


Build a solar flare detection system on SageMaker AI LSTM networks and ESA STIX data
In this post, we show you how to use Amazon SageMaker AI to build and deploy a deep learning model for detecting solar flares using data from the European Space Agency's STIX instrument.

The effective monitoring and characterization of solar flares demands sophisticated analysis of X-ray emissions across multiple energy spectrums. Machine learning-based anomaly detection serves as a powerful tool for identifying significant patterns that could indicate notable solar activity. Through the identification of distinct radiation signatures, key solar event characteristics can be detected, analyzed, and comprehensively understood. These detected patterns are essential for various applications, including space weather forecasting, solar physics investigations, and satellite operation planning. In recent years, solar monitoring capabilities have dramatically expanded, generating unprecedented volumes of X-ray measurement data. As this data continues to grow, analytical methods must evolve to efficiently process these massive datasets while capturing even the most subtle variations in solar behavior. Advanced deep learning architectures, particularly Long Short-Term Memory (LSTM) networks, have emerged as highly capable solutions for these challenges.
This post presents an implementation of LSTM neural networks for anomaly detection in multi-channel X-ray data collected by the Spectrometer/Telescope for Imaging X-rays (STIX). Our analysis emphasizes the detection of anomalous patterns across various energy ranges, spanning low (4–10 keV), medium (10–25 keV), and high (25+ keV) energy bands. This multi-channel approach facilitates comprehensive solar activity monitoring and enables robust identification of potential flare events through sophisticated pattern analysis of X-ray emission data. In this post, we show you how to use Amazon SageMaker AI to build and deploy a deep learning model for detecting solar flares using data from the European Space Agency’s STIX instrument. SageMaker AI will use Random Cut Forest (RCF), an unsupervised learning algorithm that detects abnormal data points by assigning anomaly scores based on the density and sparsity of the data points. You will learn how to implement a Long Short-Term Memory (LSTM) neural network that processes multi-channel X-ray data to identify potential solar flare events.
Key concepts
In this section, we discuss some key concepts of solar radiation analysis and machine learning (ML) in this solution.
X-ray energy channels in solar observations
X-ray emissions in our STIX data are measured across multiple energy bands, categorized into low (4–10 keV), medium (10–25 keV), and high (25+ keV) energy channels. This multi-channel approach enables comprehensive monitoring of solar activity across different energy levels. The energy bands provide crucial information about various aspects of solar flares, from their initiation to peak intensity. By analyzing patterns across these channels, we can identify different phases of solar flare evolution and characterize their intensity.
The combination of data from multiple energy channels offers detailed insights into solar flare characteristics. Higher energy channels typically indicate more intense flare activity, while lower energy channels can capture precursor events or post-flare phenomena. This multi-spectral approach allows for early detection of flare onset and accurate assessment of flare magnitude and duration.
Quaternions in spacecraft dynamics
LSTM networks are unlike traditional neural networks, in which they maintain an internal memory state that allows them to capture long-term dependencies in time series data. This unique quality places it as a Recurrent Neural Network (RNN), to where it is a variant. LSTM’s capability is particularly valuable for solar flare detection, where patterns may develop over extended time periods.
An LSTM architecture operates through a sophisticated system of gates and states. At its core, the input gate controls the flow of new information into the network, determining which data points are significant enough to be stored. Working in tandem, the forget gate evaluates existing information and decides which elements should be discarded, preventing the accumulation of irrelevant data. These decisions are reflected in the cell state, which serves as the network’s long-term memory, maintaining crucial information through the sequence processing. The output gate then regulates what information from this cell state should be presented as output at each time step.
This sophisticated architecture enables the model to learn intricate relationships between different energy channels while maintaining temporal coherence in the analysis. The multilayer approach allows the network to build increasingly abstract representations of the data, while the regularization techniques maintain reliable performance on new observations. Through continuous monitoring of reconstruction errors between predicted and actual values, the system effectively identifies anomalous patterns that may indicate solar flare events.
Time series analysis and anomaly detection
The anomaly detection system processes multi-dimensional time series data, where each dimension corresponds to a different energy channel. The LSTM model learns normal patterns in the X-ray emission data and identifies deviations that could indicate solar flare events. These anomalies might represent sudden intensity increases, unusual spectral patterns, or other signatures of solar activity.
For reliable flare detection, the LSTM analyzes both temporal and spectral characteristics of the cross channel X-ray data. Temporal analysis focuses on identifying sudden changes or unusual patterns in emission intensity over time. Spectral analysis examines the relationship between different energy channels, as solar flares often produce characteristic patterns across multiple energy bands.The combination of LSTM-based pattern recognition and multi-channel analysis creates a robust framework for automated solar flare detection. This approach can identify subtle precursor patterns, track flare evolution, and characterize flare intensity across different energy ranges, providing valuable insights for space weather forecasting and solar physics research.
Solution architecture
The solution architecture implements anomaly detection for ESA Solar Orbiter Solar STIX data using the LSTM algorithm, as illustrated in the following diagram. This solution uses Bring Your Own Script (BYOS) with Amazon SageMaker AI, so you can use your custom training scripts while using the managed infrastructure of SageMaker AI. With BYOS, you can:
- Use your preferred ML frameworks (in this case, PyTorch)
- Maintain control over your training logic
- Continue to use the training infrastructure of SageMaker AI and scaling capabilities
- Deploy your custom LSTM model without having to manage containers
To use this approach, upload your Python script to SageMaker AI and specify it as the entry point when creating your training job. The Python used for this blog post is located within the referenced GitHub repository.
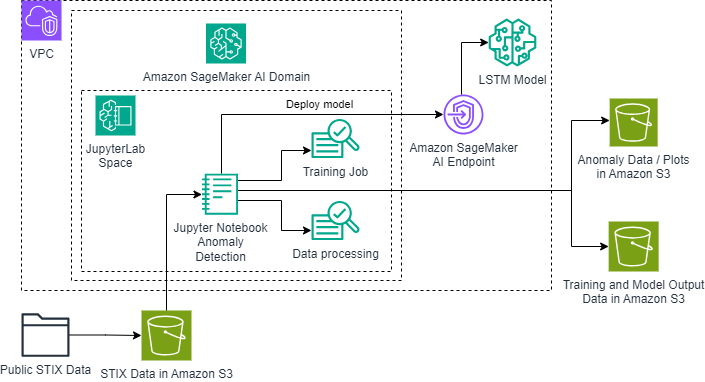
The data pipeline initiates with raw STIX (Spectrometer/Telescope for Imaging X-rays) measurements stored in FITS format. These observations undergo initial processing in a JupyterLab environment, which serves as our primary development and analysis platform. The environment hosts custom Python notebooks that handle the conversion of FITS data to CSV format and execute our advanced detection algorithms.At the heart of the system lies our neural network processing pipeline. The workflow begins with data preparation in JupyterLab, followed by the training of our specialized CrossChannelLSTM model implemented in PyTorch. This model processes X-ray emissions across multiple energy ranges (4–10 keV, 10–25 keV, and 25+ keV). Following the training phase, the system analyzes temporal sequences to identify potential solar flare signatures through anomaly detection. The pipeline culminates in the generation of comprehensive visualizations, encompassing temporal analysis plots, energy evolution diagrams, and inter-channel correlation displays.
The system produces extensive analytical outputs, including identified anomalies, detailed channel statistics, and temporal pattern analysis. The visualization suite generates intricate plots highlighting anomalous patterns across energy bands, accompanied by temporal evolution charts and model performance metrics. All findings are documented in structured CSV files, containing anomaly indicators and reconstruction error measurements, facilitating in-depth analysis of detected solar events. Throughout the entire process, strict data handling protocols maintain analytical integrity and reproducibility.
Solution overview
This solution demonstrates a comprehensive approach to solar flare detection using deep learning techniques. First, we perform data preprocessing by converting FITS file format containing STIX quicklook lightcurve data into manageable CSV format. Then, we conduct data normalization and sequence preparation to maintain quality input for our analysis. Using PyTorch, we implement a custom CrossChannelLSTM model specifically designed for detecting anomalies in multi-channel X-ray data. The system processes data across multiple energy bands to identify patterns that may indicate solar flare activity.After the model training phase, which uses multiple LSTM layers with dropout regularization, the solution provides extensive visualization capabilities. These include time series plots with anomaly highlighting, energy-time evolution visualizations, and cross-channel analysis plots for clear interpretation of the findings. The system generates detailed outputs including channel-specific statistics, temporal evolution of anomalies, and comprehensive CSV files containing anomaly flags and reconstruction errors.
This combination of deep learning architecture and visualization tools creates a robust framework for automated solar flare detection. This combination makes it particularly suitable for space weather monitoring applications where rapid detection and precise analysis are crucial. The solution’s ability to process large-scale STIX data while identifying subtle radiation patterns demonstrates its effectiveness for solar physics research and space weather forecasting.
Prerequisites
Before implementing the solar flare detection system, ensure that you have the following tools and dependencies installed.
- AWS Requirements:
- An AWS account with appropriate permissions
- IAM role with appropriate SageMaker AI and Amazon Simple Storage Service (Amazon S3) access policies
- Amazon S3 bucket for storing data and model artifacts
- Required AWS Services:
- Amazon SageMaker AI (ml.m5.2xlarge JupyterLab instance recommended)
- Amazon S3
- AWS IAM Identity Center
- The development environment requires Python 3.7 or later, along with essential Python packages included in the provided Python script and requirements file:
- For the JupyterLab environment:
- Amazon SageMaker AI Studio notebooks
- Additional requirements:
- Access to STIX data in FITS format
- Sufficient RAM for processing large datasets (recommended minimum 16GB)
- GPU support recommended for faster model training
- Basic understanding of Python programming and deep learning concepts
- Estimated Costs:
- SageMaker AI ml.m5.4xlarge instance: ~$0.922 per hour
- S3 storage: ~$0.023 per GB per month
- Total estimated cost for running this solution: ~$10–15 for a few hours of experimentation
Set up the solution
The setup process involves configuring the Amazon SageMaker AI Python environment, where all the data analysis and model training is executed.
- On the Amazon SageMaker AI console, open the SageMaker AI domain details page.
- Open JupyterLab, then create a new Python notebook instance for this project.
- When the environment is ready, open a terminal in Amazon SageMaker AI JupyterLab to clone the project repository using the following commands:
- Install the required Python libraries:
pip install -r requirements.txt
This process will set up the necessary dependencies for running anomaly detection analysis on the Solar Orbiter sensor data.
Execute anomaly detection
Update the bucket_name and file_name variables in the script with your S3 bucket and data file names.
Run the script in JupyterLab as a Jupyter notebook or run as a Python script:
python ESA_SolOrb_AD.py
Upon execution, the notebook or script performs a series of automated tasks to analyze the solar X-ray data. It begins by loading and preprocessing the FITS file, converting it to CSV format and normalizing the data across energy channels. Next, it trains the CrossChannelLSTM model using PyTorch, establishing the foundation for our anomaly detection system. When the model is operational, it processes the multi-channel X-ray data to identify potential solar flare events through pattern analysis across different energy bands (4–10 keV, 10–25 keV, and 25+ keV).
Code structure
The Python implementation centers around a solar flare detection pipeline, structured in the main script. At its core are two main classes: CrossChannelLSTM and CrossChannelDataset, which together orchestrate the workflow from data ingestion to visualization. These classes work in tandem to process STIX X-ray data and identify potential solar flare events.
The explore_ql_lightcurve method handles the initial data ingestion and preprocessing, converting FITS files to CSV format and ensuring X-ray measurements are properly formatted for analysis. The plot_lightcurve method creates initial visualizations of the data across different energy channels. The print_channel_stats method provides statistical analysis for each energy band.
The CrossChannelLSTM class implements the neural network architecture, with multiple LSTM layers and dropout regularization. The CrossChannelDataset class manages data preparation and sequencing for the model. The detect_cross_channel_anomalies method then uses this trained model to identify unusual patterns in the X-ray emissions across different energy bands.
For visualization, the plot_cross_channel_anomalies and plot_flare_anomalies methods create detailed graphs highlighting detected anomalies, temporal evolution patterns, and energy band distributions. These visualizations include time series analysis, energy-time evolution diagrams, and cross-channel correlation plots.
Together, these components create a comprehensive pipeline for processing multi-channel X-ray data and identifying potential solar flare events that warrant further investigation. The system’s modular design allows for the modification of model parameters and visualization options to suit specific analysis needs.
Configuration
Adjust the following parameters in the script as needed for appropriate use such as accuracy, performance, compute time, and other needs: The LSTM model architecture and training parameters significantly influence the detection of solar flare events.
The following parameters can be modified:
Model Architecture Parameters:
hidden_size: Size of LSTM hidden layers (default: 128–256)num_layers: Number of LSTM layers (default: 2–3)dropout_rate: Dropout regularization rate (default: 0.2)sequence_length: Length of input sequences (default: 30–50)
Training Parameters:
batch_size: Number of sequences per training batch (default: 32)num_epochs: Number of training iterations (default: 15–20)learning_rate: Rate of model parameter updates (default: 0.001)threshold_multiplier: Anomaly detection sensitivity (default: 1.5)
For improved performance on standard hardware configurations, we recommend:
hidden_size=256num_layers=3dropout_rate=0.2sequence_length=30batch_size=32num_epochs=20
Hardware requirements can significantly impact training time and model performance. GPU acceleration is recommended for faster training, though CPU-only execution is supported. Minimum recommended system specifications include 16 GB RAM and 4 CPU cores.
The system supports customization of visualization parameters and output formats. Results can be saved as CSV files containing detailed anomaly flags and reconstruction errors for each energy channel. The visualization suite can be configured to display different aspects of the analysis, from time series plots to energy band distributions.
Data
The script uses public ESA Solar Orbiter STIX (Spectrometer/Telescope for Imaging X-rays) data in FITS file format. The data contains X-ray measurements across multiple energy channels, ranging from 4 keV to over 25 keV. The FITS files include:
- Time series data for each energy channel
- Energy band information (4–10 keV, 10–25 keV, 25+ keV)
- Control indices and timing information
- Measurement error data
- Trigger counts across channels
The data is organized in a hierarchical structure within the FITS file, with separate HDUs (Header Data Units) containing different aspects of the measurements. The script converts this data to CSV format with columns for timestamps, counts per energy channel, and associated error measurements.
When preparing your own data for analysis, ensure it follows the STIX data format specifications and contains complete measurements across all energy channels. The system expects continuous time series data with consistent sampling rates for reliable anomaly detection.
Results
The LSTM-based anomaly detection system generates comprehensive visualizations across multiple energy channels, as shown in the plots. The analysis covers five distinct energy bands ranging from 4.0 keV to 84.0 keV, with each channel revealing different aspects of solar activity.
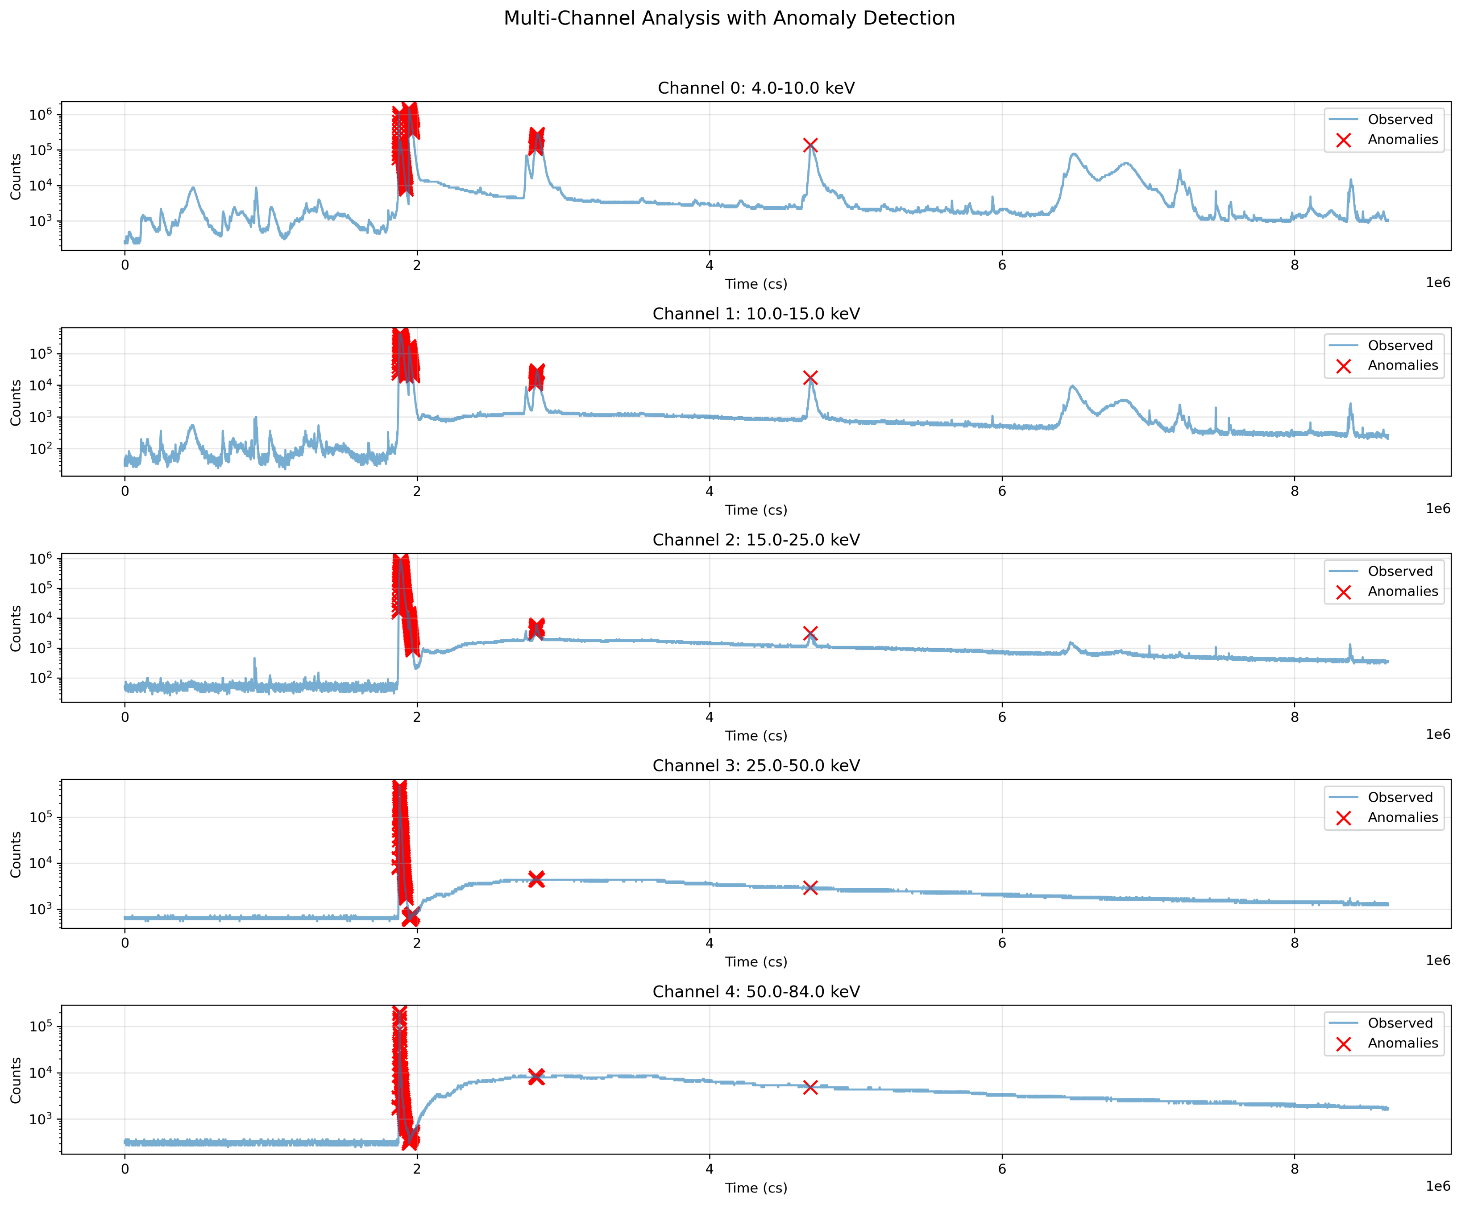
- Channel 0 (4.0–10.0 keV) shows baseline activity around 10³ centiseconds with significant spikes reaching 10⁶ centiseconds
- Channel 1 (10.0–15.0 keV) displays similar patterns but with slightly lower baseline counts
- Channel 2 (15.0–25.0 keV) demonstrates clearer distinction between background and event periods
- Channel 3 (25.0–50.0 keV) shows strong event signatures with lower background noise
- Channel 4 (50.0–84.0 keV) captures the highest energy emissions with very clear signal-to-noise ratio
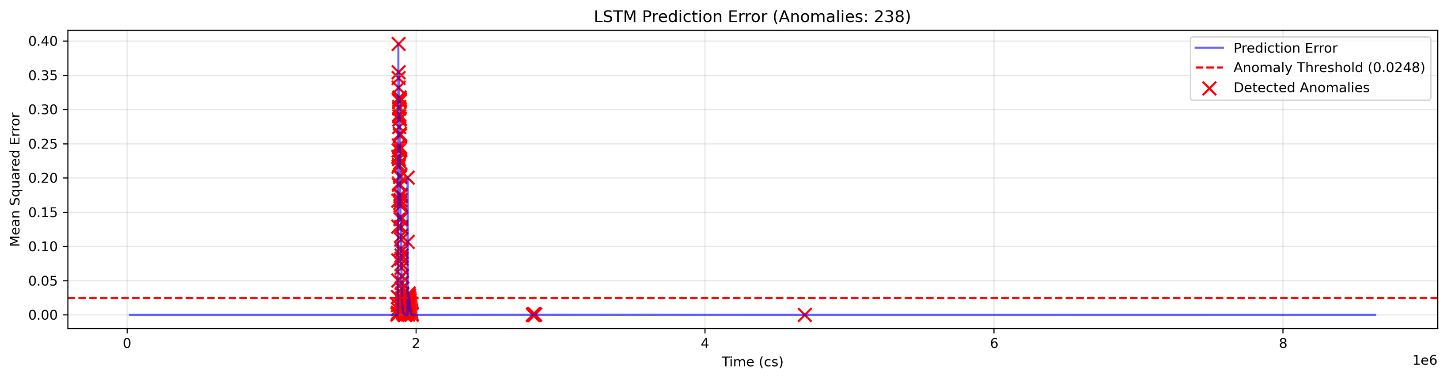
The system identified 238 anomalous points across the dataset, primarily clustered around three major events at approximately 2 million, 3 million, and 5 million centiseconds (cs) in the time series. These events are particularly notable as they appear simultaneously across multiple energy channels, suggesting significant solar flare activity.The bottom panel shows the LSTM Prediction Error with an anomaly threshold of 0.0112. Points exceeding this threshold (marked in red) correspond to sudden intensity changes across multiple channels. The largest prediction errors coincide with the onset of major events, where the model identifies rapid changes in X-ray emissions.
The logarithmic scale representation of counts reveals both subtle variations in background radiation and dramatic intensity increases during flare events, demonstrating the model’s ability to detect both major and minor anomalies in solar activity.
Clean up
After running the analysis and saving the plots to S3, perform the following clean-up steps to manage system resources:Close any open matplotlib figures to clear up memory:plt.close('all')Clear any temporary files created during plot generation:
If running in JupyterLab, you can shut down unused kernels through the Running Terminals and Kernels panel to clear up system resources.Consider removing any large FITS files that were converted to CSV if they’re no longer needed for analysis.These clean-up steps help maintain efficient resource usage and prevent unnecessary storage consumption. If you’ve modified the code to save intermediate results, make sure that those temporary files are also removed if no longer needed.
If you’re using JupyterLab and want to avoid further charges, clean up Amazon SageMaker AI notebook instance resources running the LSTM JupyterLab Python notebook and delete any SageMaker AI endpoints created. You can also delete your S3 data. Here are some Python commands to do so.
Delete SageMaker AI endpoints:
Stop SageMaker notebook instance:
Delete training data and artifacts from S3:
Estimated cost savings: ~$22 per day by stopping the ml.m5.4xlarge instance.
Conclusion
In this post, we demonstrated how LSTM neural networks can effectively detect anomalies in solar X-ray data from ESA’s Solar Orbiter STIX instrument. By analyzing patterns across multiple energy channels ranging from 4.0 to 84.0 keV, we’ve shown how deep learning can enhance our understanding of solar flare events and their characteristics. The custom CrossChannelLSTM model successfully processes complex, multi-dimensional X-ray data, identifying 405 anomalous events across different energy bands.
Our results show clear detection of major solar events, particularly visible around the 2-million centisecond mark where we observe significant intensity increases across all energy channels. The system’s ability to detect anomalies simultaneously across multiple channels provides strong validation of genuine solar flare events, as opposed to instrumental artifacts or noise. Through efficient batch processing and normalized data handling, we can analyze large-scale solar observation data effectively, and our visualization approach enables quick identification of potential solar flare events.
Although this solution focuses on STIX data analysis, the approach has broad applications throughout solar physics and space weather forecasting. The same architecture could be adapted for various types of solar observations, space weather monitoring, and other time-series astronomical data analysis. This integration of deep learning with solar physics creates a robust, scalable platform for space weather analytics, which is becoming increasingly valuable as we rely more on space-based technologies.Looking forward, this solution opens many possibilities for enhancement and expansion. Real-time flare detection could be implemented for live solar monitoring, providing immediate alerts during significant events. The system can be enhanced by incorporating additional wavelength bands and sensor data, and automated alert services can be developed to provide immediate notification of detected solar flares. Further developments might include extending the analysis to incorporate predictive capabilities for solar flare forecasting and creating custom metrics tailored to specific space weather monitoring requirements.
The code and implementation details are available in our GitHub repository, so you can adapt and enhance the solution for your specific solar physics research needs. For space weather operations, the combination of deep learning and multi-channel analysis has strong potential to play an increasingly crucial role in understanding and predicting solar activity.
To learn more about the AWS services used in this solution, refer to Guide to getting set up with Amazon SageMaker AI, Train a Model with Amazon SageMaker, and the Amazon SageMaker AI Developer Guide.


![KAIZEN Locations & Map Guide – Boss, Chest, Weapon, Style [KASHIMO]](https://www.destructoid.com/wp-content/uploads/2026/02/kaizen-locations-and-map-guide.jpg)