
















Streaming benchmark and recommendation results to MLflow with Amazon SageMaker AI
In this post, you learn how to use the new MLflow integration with Amazon SageMaker AI optimized inference recommendation jobs and Amazon SageMaker AI benchmark jobs to automatically stream experiment data into a unified tracking interface. This integration streams metrics, parameters, and charts into your serverless Amazon SageMaker MLflow App in real time and you get a unified experiment tracking experience.
Teams benchmarking generative AI models often evaluate dozens of GPU instance types, serving containers, parallelism strategies, and optimization techniques such as speculative decoding before deploying to production. Practitioners can spend weeks navigating configuration decisions and manually piecing together what they tried, what worked, and why. That complexity is exactly why we introduced optimized generative AI inference recommendations for Amazon SageMaker AI: to help teams move from manual trial-and-error to guided, data-driven optimization and benchmarking.
Today, we are adding MLflow integration so teams can stream AI benchmark and recommendation results into a single place to track every experiment. This integration reduces data silos, accelerates iteration cycles, and brings full reproducibility to your inference optimization workflows.
In this post, you learn how to use the new MLflow integration with Amazon SageMaker AI optimized inference recommendation jobs and Amazon SageMaker AI benchmark jobs to automatically stream experiment data into a unified tracking interface.
This integration streams metrics, parameters, and charts into your serverless Amazon SageMaker MLflow App in real time and you get a unified experiment tracking experience.
Solution overview
With this release, when you submit an optimized inference recommendation job or a benchmarking job, Amazon SageMaker AI automatically streams results into a SageMaker MLflow app of your choice. Submit multiple jobs to the same MLflow experiment, and you can select them in the MLflow experiment view to compare side by side, with no manual data wrangling required.
The following diagram shows how you can set up MLflow with your benchmarking and recommendation jobs:
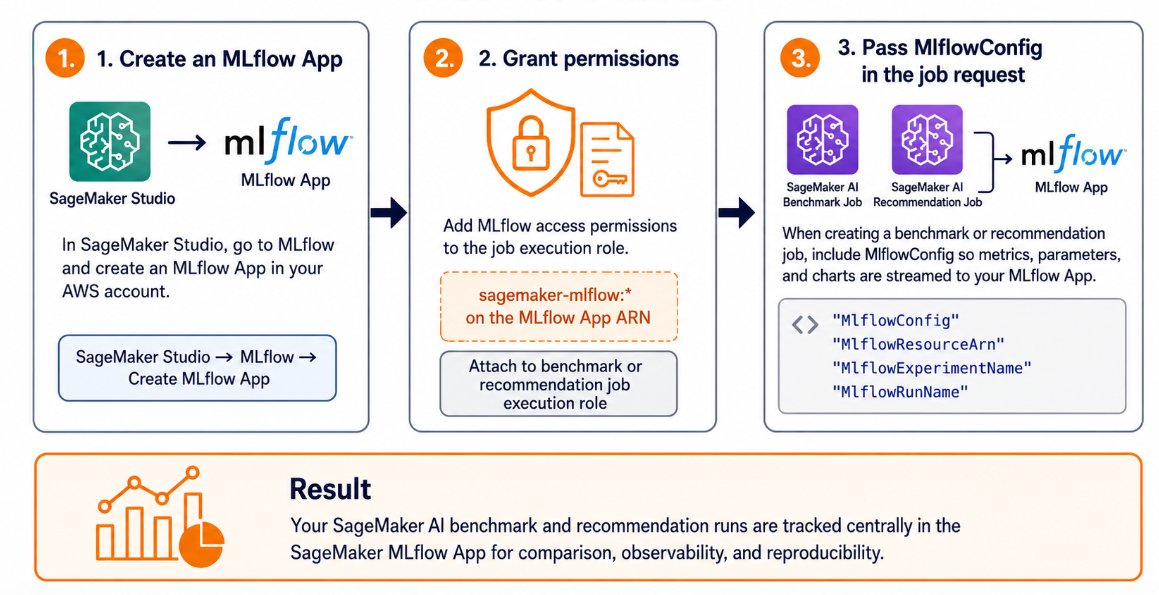
You follow these steps to set up MLflow with your existing recommendations and benchmarking jobs:
- Create an MLflow App: In your AWS account, open Amazon SageMaker Studio. Then go to MLflow and choose Create MLflow App.
- Grant permissions: Add
sagemaker-mlflow:*on the MLflow App ARN to your job’s execution role. - Pass
MlflowConfigwhen creating your benchmark or recommendation job.
Benefits of this implementation
Some of the benefits of this implementation are:
Eliminate manual data consolidation: With native MLflow integration, benchmark and recommendation results from multiple jobs are consolidated under the same experiment name automatically. This removes the need to manually collect metrics, logs, and configurations across separate runs. You can then compare runs side by side to understand how instance type, model configuration, batch size, or speculative decoding affects performance. For example, you can compare qwen2-0.5b on ml.g4dn.12xlarge versus ml.p4d.24xlarge.
Monitor long-running jobs in real time: Benchmark and recommendation jobs can take hours. Rather than waiting for completion without visibility, you can now watch metrics stream live into the MLflow UI. Latency and throughput metrics update as each configuration is tested, giving you an observable process from start to finish. We publish live metrics in the metrics section, and they update over time instead of being published only at the end of the job. You can use these metrics to check whether throughput is as expected in the recommendation job and stop it early if it is not.
Maintain a complete audit trail: Experiment runs capture the full context: job parameters, timestamps, metrics at checkpoints, and emitted artifacts. This audit trail stays queryable and reproducible for months. You can trace which configuration changes drove improvements, identify performance plateaus, and revisit past decisions with full context.
Better collaboration and governance: A shared MLflow experiment becomes the single source of truth for an optimization effort. Team members can review what’s been tried, what worked, and what didn’t, which reduces duplicated effort and supports informed handoffs between shifts or team members.
Technical walkthrough: Track SageMaker AI benchmarking and recommendations in MLflow
In this example, a customer has deployed Qwen/Qwen2-0.5B-Instruct to an Amazon SageMaker AI real-time endpoint using an OpenAI-compatible serving stack on ml.g6.12xlarge. The team has two questions to answer: how the existing Qwen endpoint performs for a lightweight chatbot workload, and what configuration to use for a larger workload with longer prompts and responses.
To make the evaluation reproducible, both the benchmark job and recommendation job write metrics, parameters, and charts to the same SageMaker MLflow experiment. The benchmark job evaluates an existing SageMaker endpoint. The recommendation job evaluates deployment options for the Qwen model artifact stored in Amazon Simple Storage Service (Amazon S3) and returns ranked configurations. We will use a walkthrough notebook to show you how you can set up MLflow with both recommendations using Qwen/Qwen2-0.5B-Instruct on ml.g6.12xlarge instance for latency optimization
The end-to-end walkthrough typically takes 45–120 minutes, depending on endpoint readiness, model size, workload configuration, instance availability, and recommendation job search space.
Prerequisites
This notebook walks you through how you can set up your MLflow app for benchmark and recommendations jobs experiment tracking. You need to complete the following steps to get started with running this notebook.
- Set up Amazon SageMaker Studio for your development environment on Amazon SageMaker AI.
- Create a SageMaker MLflow App from SageMaker Unified Studio (SageMaker Unified Studio → MLflow → Create MLflow App).
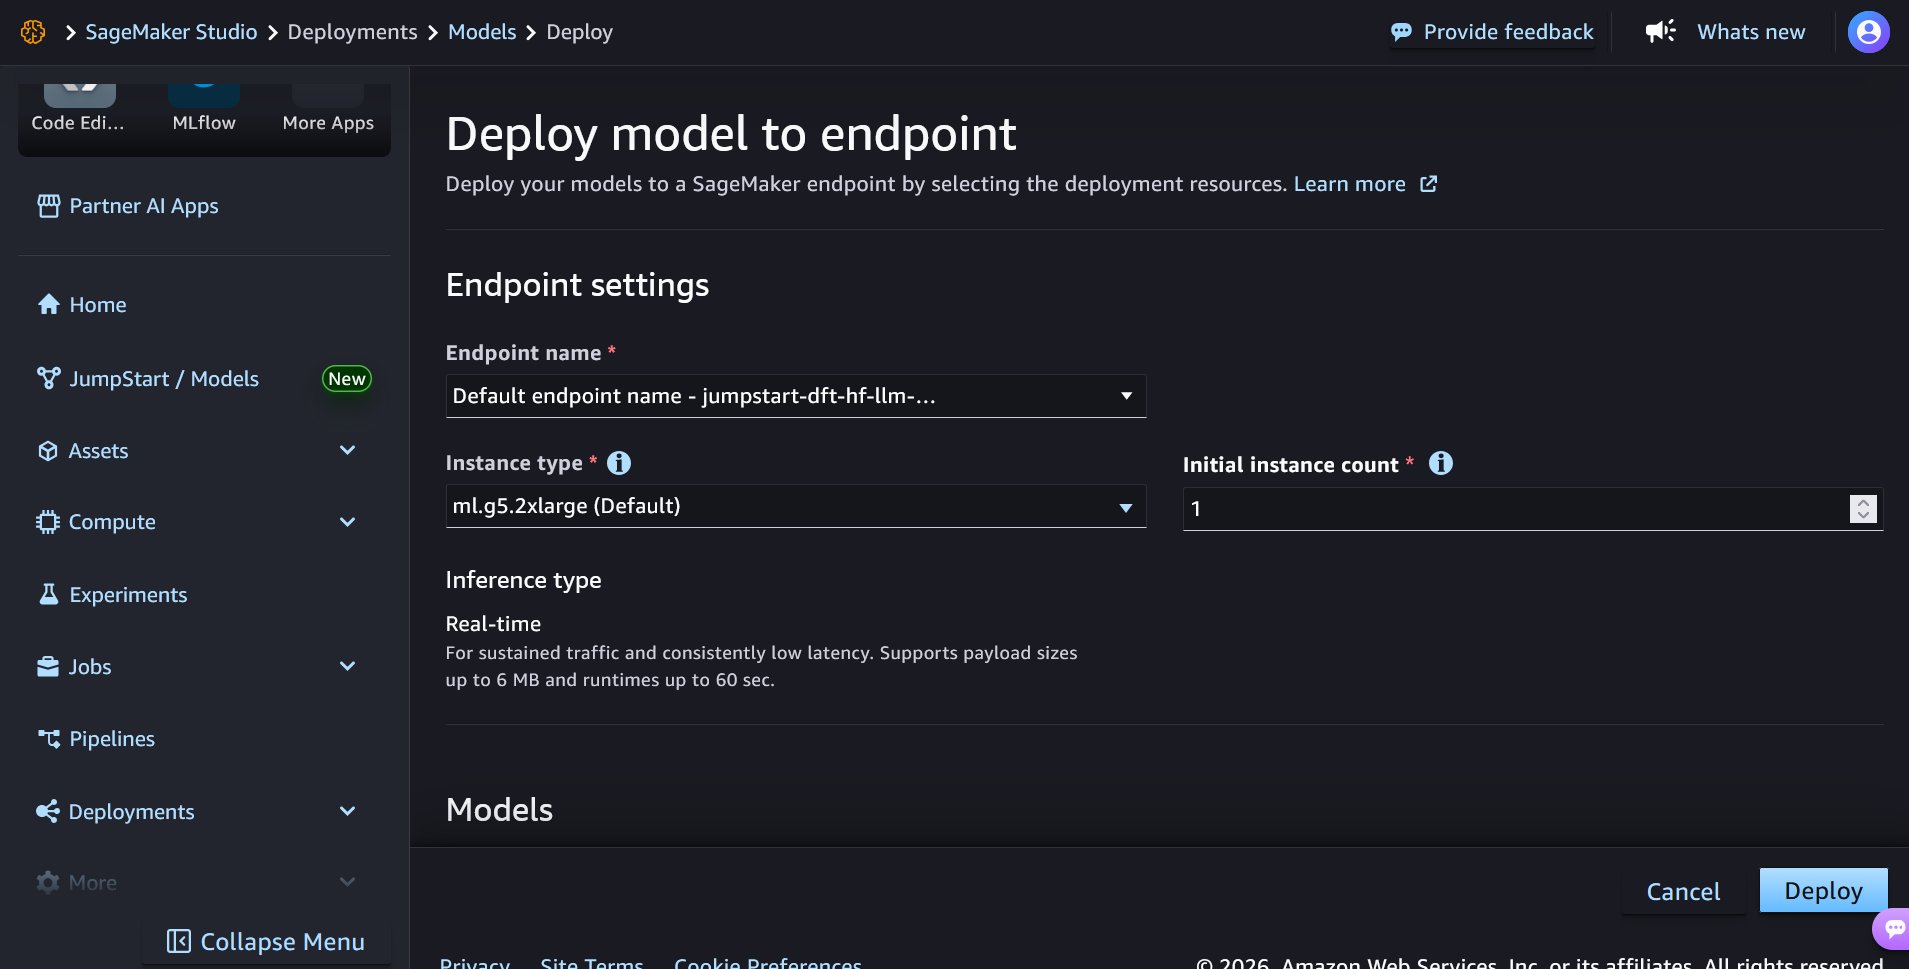
- A SageMaker endpoint running an OpenAI-compatible model (already InService) for the benchmark job. You can deploy the Qwen 2 0.5B model from the Amazon SageMaker JumpStart Studio UI to get started as shown in the following diagram:
- A model artifact in Amazon S3 for the recommendation job.
- An AWS Identity and Access Management (IAM) execution role with
AmazonSageMakerFullAccessplus inline policies for MLflow and endpoint invoke access. See the accompanying notebook for IAM role creation steps.
Key considerations
- This integration supports SageMaker MLflow Apps and does not stream results to self-hosted MLflow tracking servers.
- Set
tooling.versionto 0.8.0 or later to use MLflow nested run support. - Recommendation jobs provision their own endpoints internally, so do not pass
ComputeSpec.InstanceTypesunless you have a specific reason to constrain the search space. The execution role must include the required SageMaker, MLflow, Amazon S3, and endpoint invocation permissions. The S3 output bucket must be in the same Region as the job.
For the complete end-to-end notebook, including additional examples with AIRecommendationJob, see the step-by-step tutorial.
Step 1: Set up your environment
Start by setting your environment variables and initializing the SageMaker client.
Step 2: Resolve the execution role
Amazon SageMaker AI uses the execution role to run the benchmark and recommendation jobs. It must have permissions to access SageMaker, invoke endpoints, write job output to Amazon S3, and publish tracking information to the SageMaker MLflow App. Follow the notebook to create the IAM roles.
The role should include the following permissions:
| Permission area | Required access |
| SageMaker job execution | AmazonSageMakerFullAccess, or a scoped equivalent |
| MLflow integration | sagemaker-mlflow:*, sagemaker:CallMlflowAppApi, sagemaker:DescribeMlflowApp |
| Endpoint invocation | sagemaker:InvokeEndpoint, sagemaker:InvokeEndpointWithResponseStream |
| S3 output | Read/write access to the configured output bucket |
Configure the execution role trust policy to allow SageMaker to assume the role. In some environments, you may also need to include the account root principal depending on how the role is created and passed.
Step 3: Verify the MLflow App and define experiment names
Next, verify that the SageMaker MLflow App is available. Then define a shared experiment name and unique run names for the benchmark and recommendation jobs.
Using the same MlflowExperimentName for both jobs makes it easier to compare results in one place.
Step 4: Submit the benchmark job
A SageMaker AI benchmark job evaluates an existing endpoint using a workload specification. In this example, the workload uses NVIDIA AIPerf with an OpenAI-compatible API schema.
The key field is MlflowConfig in OutputConfig. This tells SageMaker to stream benchmark metrics, parameters, and charts directly into your SageMaker MLflow App.
Step 5: Submit the recommendation job
SageMaker AI recommendation jobs evaluate deployment configurations and recommend options based on your workload and performance target. Unlike benchmark jobs, recommendation jobs provision their own endpoints internally during the evaluation process.
The following example uses the same MLflow experiment name as the benchmark job, so both runs appear together in the SageMaker MLflow App.
Step 6: Compare results in MLflow
After the jobs complete, open the SageMaker MLflow App and navigate to the experiment you configured. The following code gives you the URL to your MLflow app in the notebook.
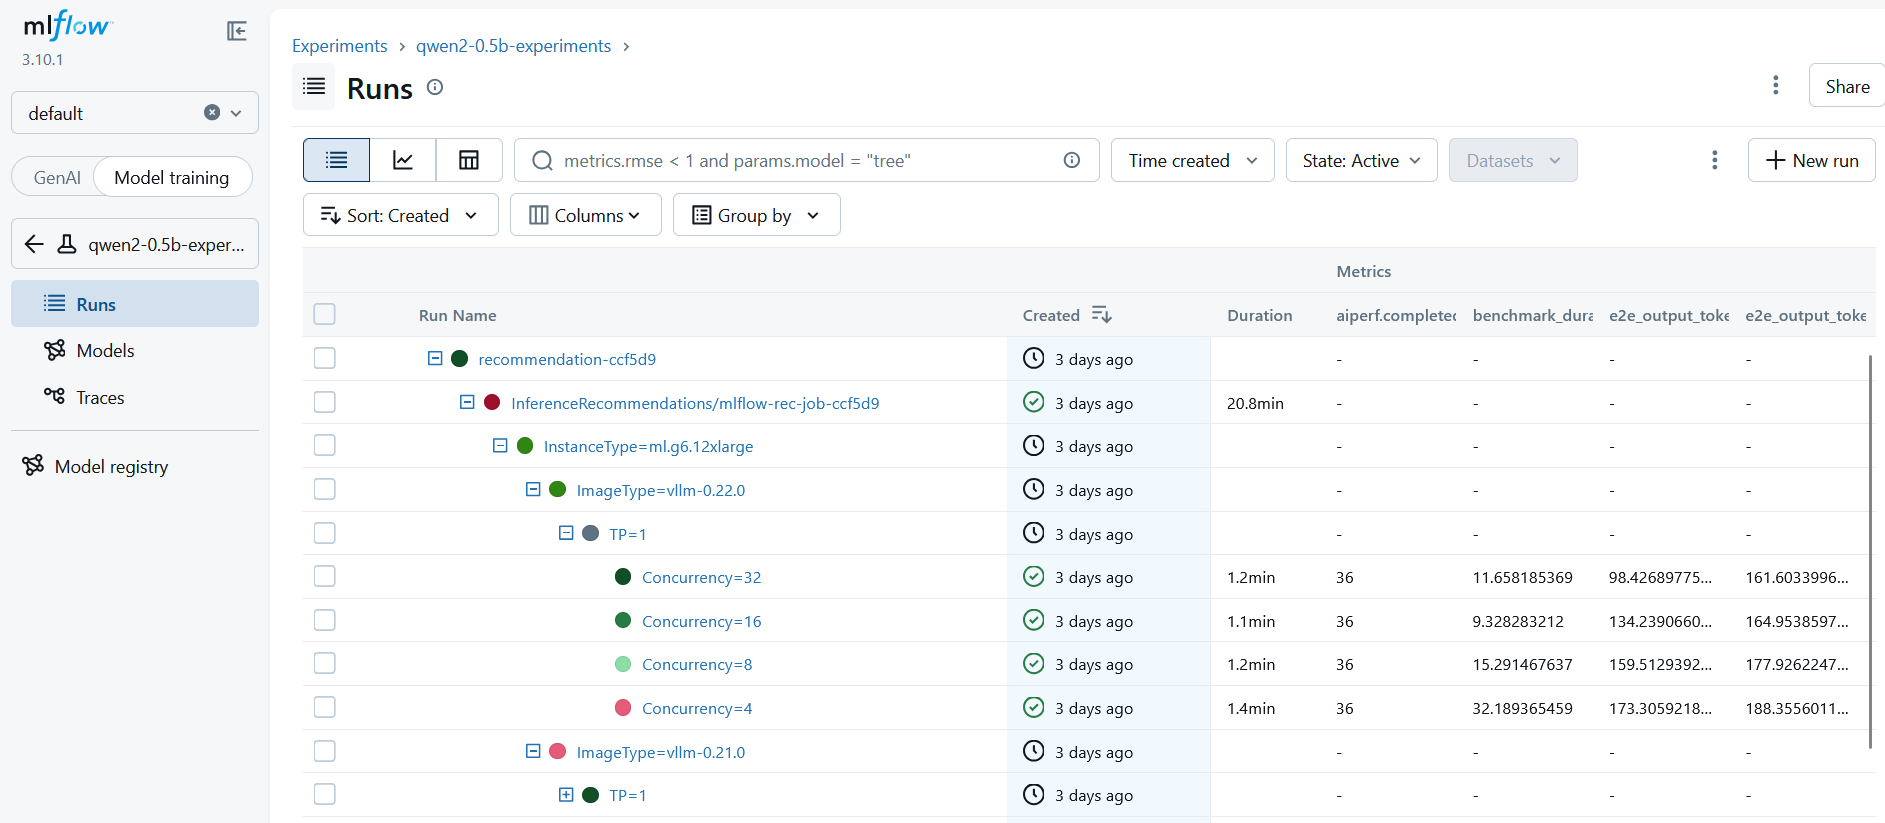
In the experiment view, the parent runs are empty placeholders that exist to show relationships between child runs. You need to expand each parent run to view the nested metrics.
benchmark-        -> Single run with AIPerf benchmark metrics
recommendation-   -> Nested run tree with ranked recommendation configurations
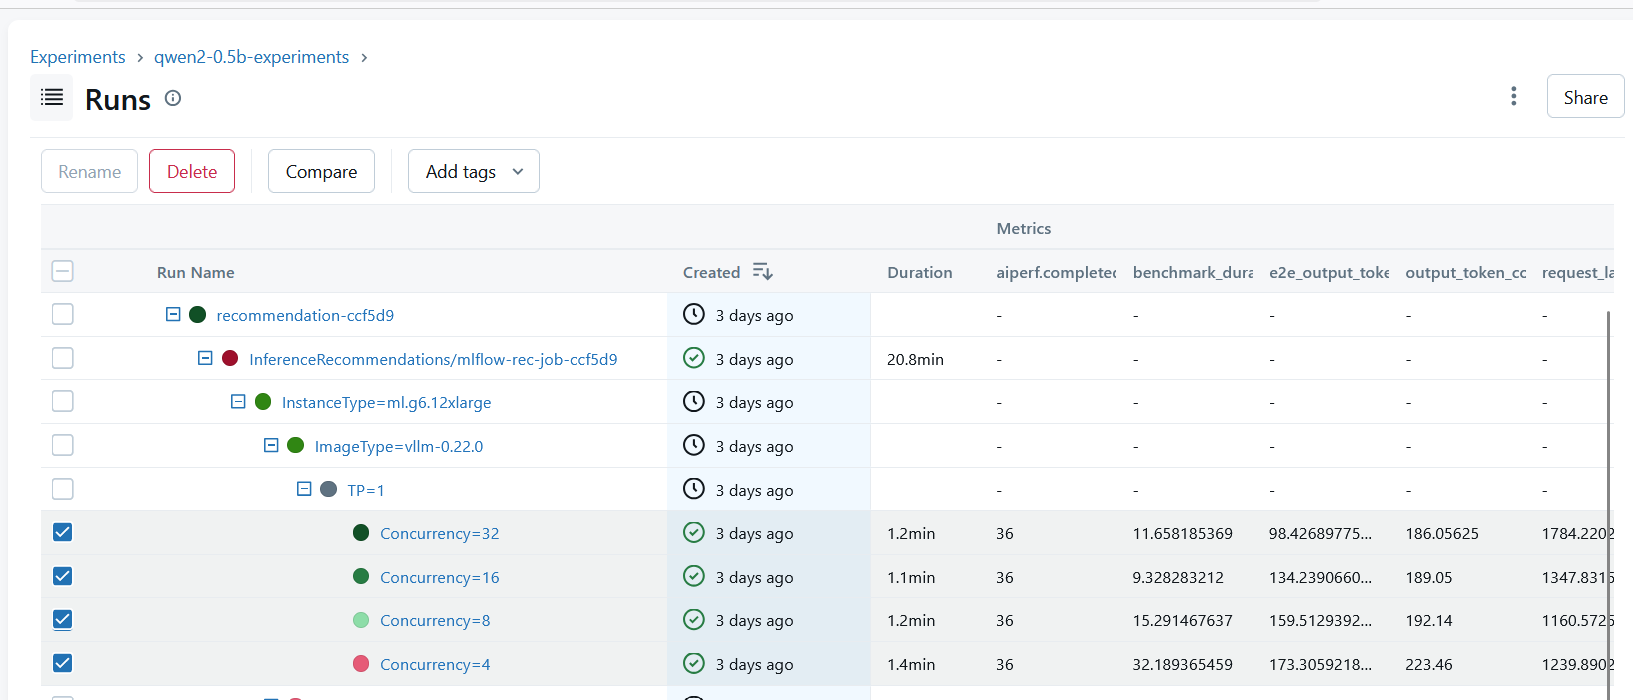
The child runs contain the model metrics. To review recommendation job metrics, go to the MLflow Runs page, expand the recommendation job parent run, and then expand the nested child runs until the concurrency rows are visible. The benchmark metrics appear in the Metrics columns for each concurrency run as shown in the following diagram:
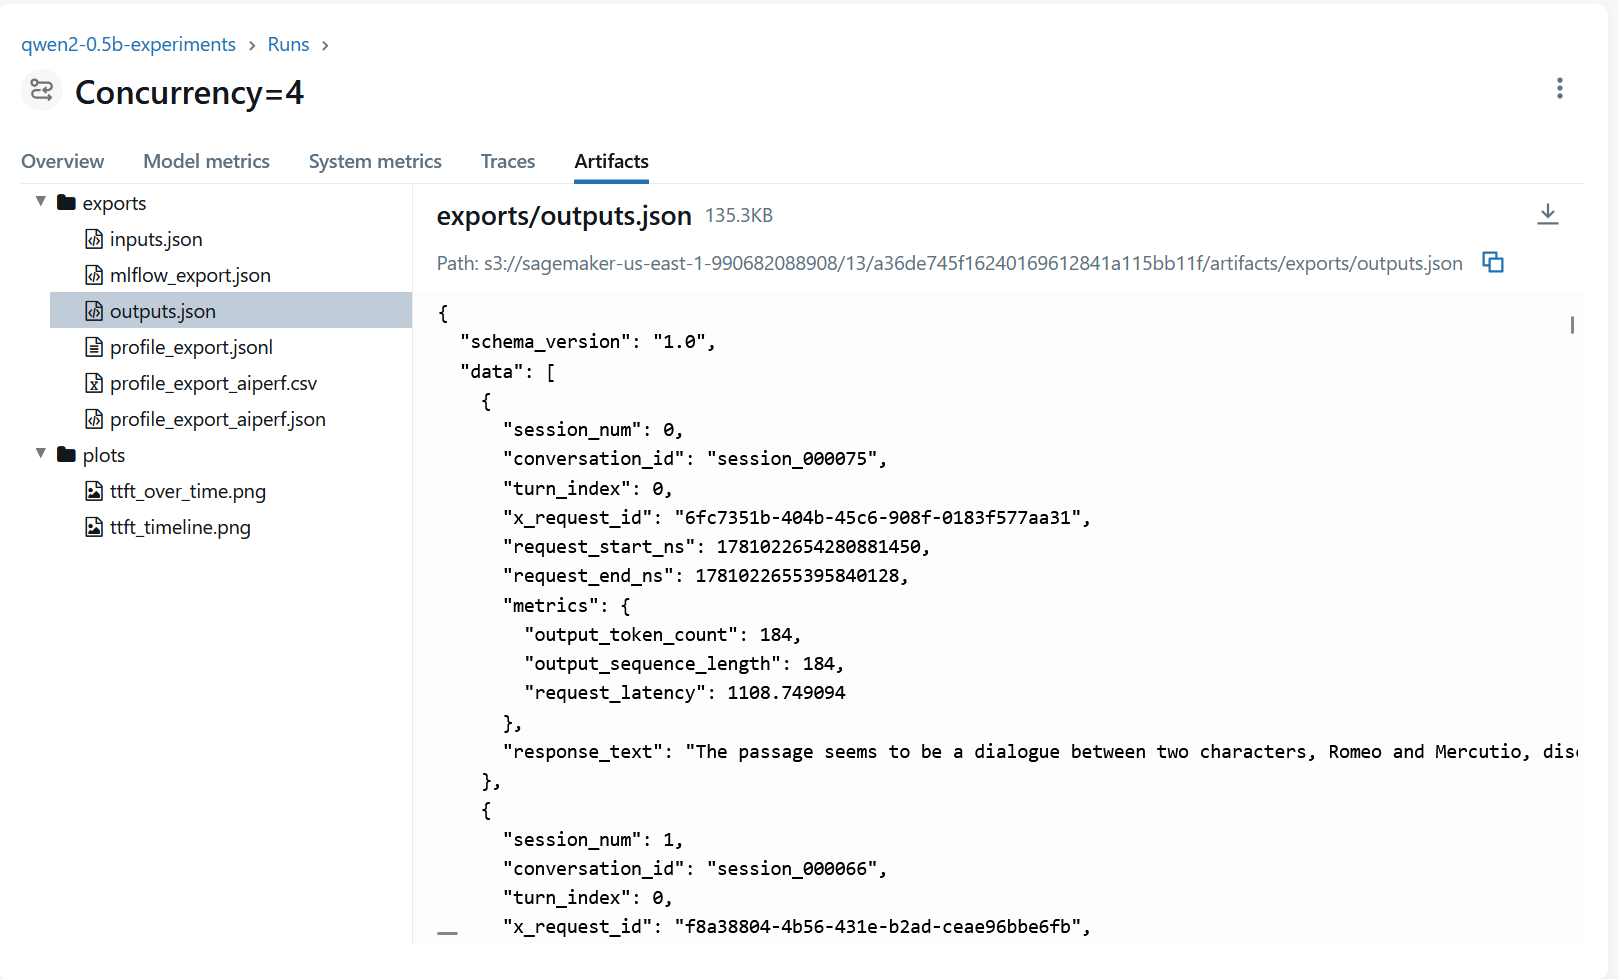
To inspect recommendations artifacts, open the Concurrency=4 run and choose the Artifacts tab. In the artifact file tree, expand exports and select outputs.json. The preview panel shows the artifact file path and JSON output, including request-level fields such as session ID, request timing, output token count, request latency, and response text as shown in the following diagram:
On the Runs page, select the benchmark runs you want to compare, such as the Concurrency=32, Concurrency=16, Concurrency=8, and Concurrency=4 rows. Choose Compare to view metric differences across duration, throughput, output token count, and request latency as shown in the following diagram:
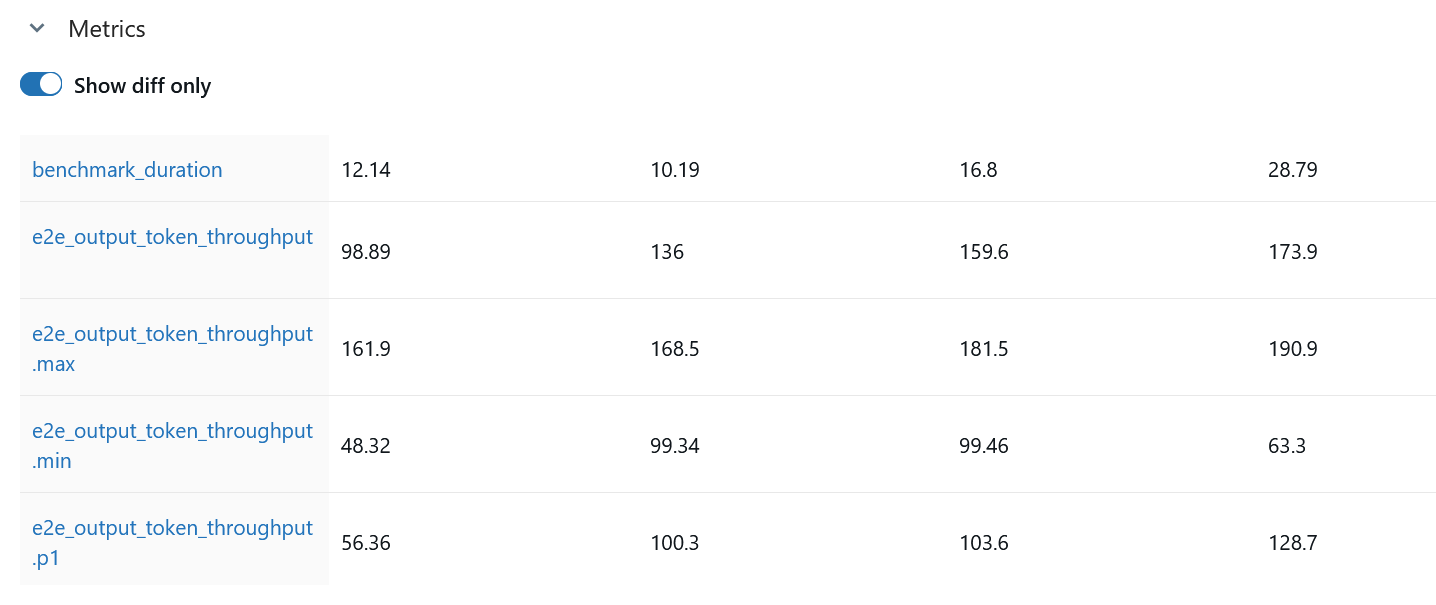
In the Metrics section, use the Show diff only toggle to view only changed metrics. The table compares benchmark metrics such as benchmark duration and end-to-end output token throughput across the selected benchmark or recommendation job results as shown in the following diagram:
Clean up resources
To avoid ongoing charges, delete the resources you created during this walkthrough. Remove the SageMaker MLflow App from SageMaker Unified Studio and delete the benchmark and recommendation jobs. Terminate any SageMaker endpoints you deployed for testing and remove the S3 output objects if they are no longer needed. If you created a dedicated IAM role for this tutorial, delete it along with its inline policies.
Conclusion
The MLflow integration for SageMaker AI BenchmarkJob and AIRecommendationJob makes experiment results easier to track and understand. By streaming results directly into a familiar tracking interface, this integration removes the manual overhead that slows you down and provides real-time monitoring that saves compute costs. It also provides the reproducibility that production machine learning (ML) workflows demand.
Start comparing experiments in seconds. Add MlflowConfig to your next benchmark job, open the generated runs in MLflow, and compare metrics such as benchmark duration, throughput, output token count, and request latency across configurations.
To learn more about Amazon SageMaker AI optimization capabilities, visit the SageMaker documentation and the GitHub notebook to get started.
About the authors