

![LUMI MENAGERIE [Endgame Content]](https://clan.fastly.steamstatic.com/images/39206668/16c2657022c6007f2b6745eae48ffa25699199e5.png?#)












Build a unified semantic layer across datasets with multi-dataset Topics in Amazon Quick
In this post, we walk through how multi-dataset Topics work, explain how the chat agent uses defined relationships to generate cross-dataset queries, and demonstrate an end-to-end implementation using a retail analytics scenario in Quick Sight.

Amazon Quick is an AI-powered unified intelligence service that connects structured data and unstructured enterprise content so teams can explore, analyze, and act from one place. Amazon Quick Sight, the business intelligence (BI) capability within Amazon Quick, delivers interactive dashboards, natural language querying, pixel-perfect reports, machine learning (ML)-driven insights, and embedded analytics. Topics in Quick function as the semantic layer that business users can use to ask questions in natural language and get answers directly from their data.
Until now, organizations modeled their semantic layers by creating enriched datasets and associating them one-to-one with topics. Also, when Quick Sight authors build analysis, one visual could be sourced from only one dataset. Quick Sight represents a dataset as a single flattened table. If a customer’s data source contains multiple tables, Quick Sight required customers to define the dataset by joining the source tables into a single table in Quick Sight data preparation. This one big denormalized table approach was initially designed to provide better performance by avoiding run-time joins. It worked well for straightforward datasets, which made up the majority of use cases during the early stages of Quick Sight. Today, we’re evolving this model. With multi-dataset Topics (public preview), you can now add up to 12 datasets to a single topic and define relationships between them. The Quick chat agent automatically traverses those relationships when answering questions. The AI engine interprets user intent, identifies which datasets contain the relevant columns, constructs the appropriate SQL joins based on your defined relationships, and returns a unified answer. Your data stays normalized, your governance stays centralized, and your business users get richer answers without understanding the underlying schema. The same multi-dataset topic can be used for building the analysis or answering questions using the chat agent.
In this post, we walk through how multi-dataset Topics work, explain how the chat agent uses defined relationships to generate cross-dataset queries, and demonstrate an end-to-end implementation using a retail analytics scenario in Quick Sight.
How multi-dataset Topics work
A Topic in Quick is the semantic layer between raw data and business users. It encapsulates the metadata, business rules, relationships, and context that the AI-powered natural language query (NLQ) engine uses to interpret natural language questions and translate them into precise analytical queries.
With multi-dataset Topics, this semantic layer now spans multiple datasets connected through explicitly defined relationships. The following diagram illustrates the end-to-end flow from data sources through to consumption.
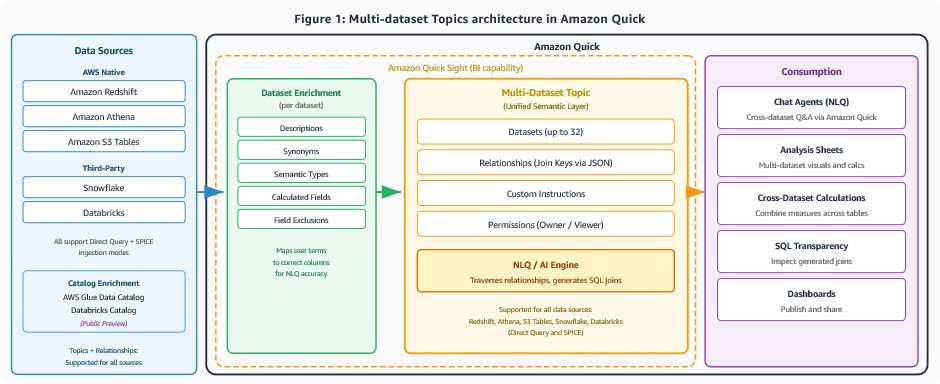
Figure 1: Multi-dataset Topics architecture flow showing how data sources feed into enriched datasets, which are combined in a topic with relationships and custom instructions, then consumed through chat and analysis.
The architecture consists of four layers:
1. Data sources. Your normalized datasets connect to Quick Sight from supported sources. During private preview, multi-dataset Topics support SPICE (Super-fast, Parallel, In-memory Calculation Engine) datasets. Public preview expands support to Direct Query against Amazon Redshift, Amazon Athena, Amazon S3 Tables, Snowflake, and Databricks. You can’t combine SPICE and Direct Query datasets within a single topic as of today.
2. Dataset enrichment with or without catalogs. Each dataset is independently enriched with semantic metadata that improves NLQ accuracy. Enrichment includes column descriptions (explaining what each field represents), synonyms (alternative terms business users might use), semantic types (City, State, Currency, Date), calculated fields, and field exclusions. The NLQ engine uses this metadata to map natural language terms to the correct columns. You can now create enriched datasets in Quick or bring them in using catalogs from AWS Glue (AWS Glue Data Catalog) and Databricks Unity Catalog. For example, when a user asks about “headcount,” the engine matches a defined synonym to the appropriate column.
3. Multi-dataset topic. The topic serves as the unified container that brings datasets together. It holds:
- Datasets (up to 12 in preview). Each dataset maintains its own enrichment and connects to its own data source.
- Relationships. Join keys defined between dataset pairs tell the NLQ engine how tables relate. You upload a JSON file that maps columns between datasets (for example, a fact table’s foreign key joins to a dimension table’s primary key).
- Custom instructions. Persistent natural language rules that guide the AI in interpreting domain-specific terminology. These handle disambiguation, custom date logic (fiscal year boundaries), and business definitions.
- Permissions. Owners can modify the topic. Viewers can ask questions and use the topic in analysis but can’t change its configuration.
4. Consumption. Business users interact with the topic through multiple surfaces:
- Chat. Users ask natural language questions in the chat interface. The NLQ engine parses the question, identifies relevant columns across datasets, constructs SQL with appropriate joins, and returns the answer as a table or visualization.
- Analysis sheets. Authors build visuals using fields from multiple datasets within the topic. Calculated fields can reference columns spanning different datasets.
- Cross-dataset calculations. You can create calculated fields that combine measures and dimensions from different datasets, and the engine handles the underlying join logic.
How the chat processes cross-dataset questions
When a business user asks a natural language question that spans multiple datasets, the NLQ engine performs the following steps:
1. Intent parsing. The engine identifies which columns map to the user’s terms by matching against column names, descriptions, and synonyms from the enrichment metadata. It determines which datasets contain the relevant measures and dimensions.
2. Relationship traversal. Using the defined join keys, the engine determines the shortest join path between the identified datasets. It follows the relationship graph to connect fact tables to the necessary dimension tables.
3. SQL generation. The engine constructs a SQL query with the appropriate JOIN clauses, aggregation (SUM for “total”), and GROUP BY for the requested dimensions.
4. Result presentation. The answer is returned as a visualization or table, with the generated SQL available for inspection.
This process is transparent. Users can view the generated SQL to verify that the correct datasets and joins were used. The richer your enrichment metadata and custom instructions, the more accurately the engine interprets ambiguous questions.
Worked example: Show total sales by customer segment and store region
Consider the question: “Show total sales by customer segment and store region.”
Step 1 – Intent parsing. The engine maps:
- “total sales” →
SUM(SALES_FACT.SALE_AMOUNT). - “customer segment” →
CUSTOMER_DIM.SEGMENT(matched via synonym “segment”). - “store region” →
STORE_DIM.REGION(matched via synonym “region”).
Step 2 – Relationship traversal. The engine identifies that answering this question requires three datasets: SALES_FACT, CUSTOMER_DIM, and STORE_DIM. Using the defined relationships:
SALES_FACT.CUSTOMER_ID→CUSTOMER_DIM.CUSTOMER_ID.SALES_FACT.STORE_ID→STORE_DIM.STORE_ID.
It constructs a two-hop join path through SALES_FACT as the hub.
Step 3 – SQL generation. The engine produces:
Step 4 – Result presentation. The answer renders a visual or table with all details. The user can inspect the generated SQL using the Explanation feature.
Feature availability
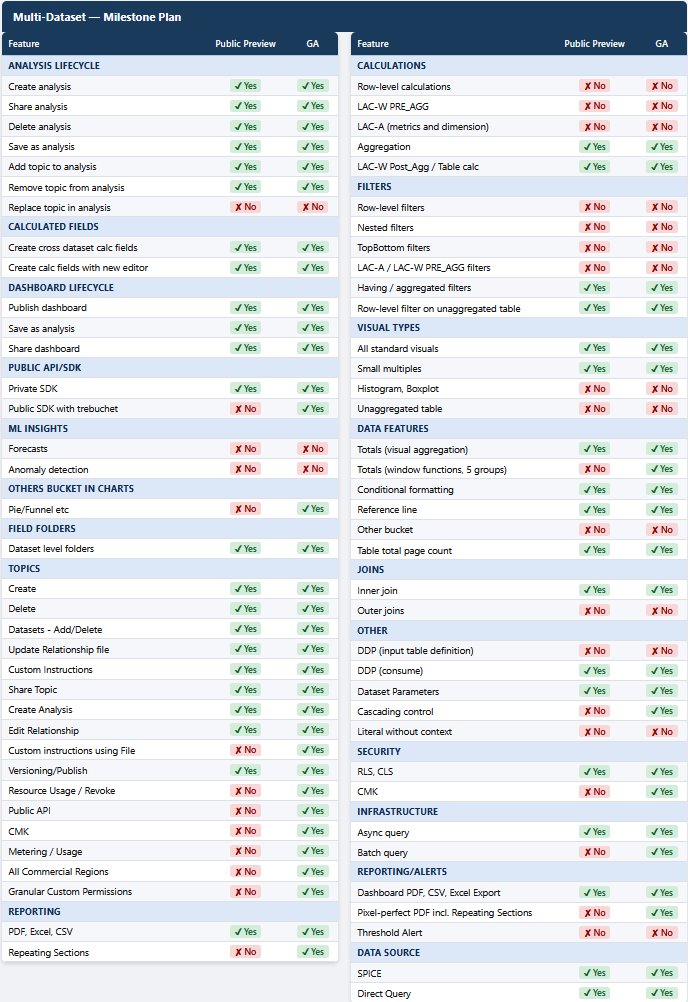
Multi-dataset Topics are launching progressively. The following table summarizes feature availability for Quick Sight BI visual building. To use a Topic in Quick chat agent, no such limitations apply.
Legend: Yes = Available | No = Not Available | Planned = Planned for future release
Solution overview
For this walkthrough, we build a multi-dataset topic for a retail analytics scenario at AnyCompany. The scenario uses five datasets modeled in a star schema pattern.
The following diagram illustrates the star schema relationship pattern used in this implementation.
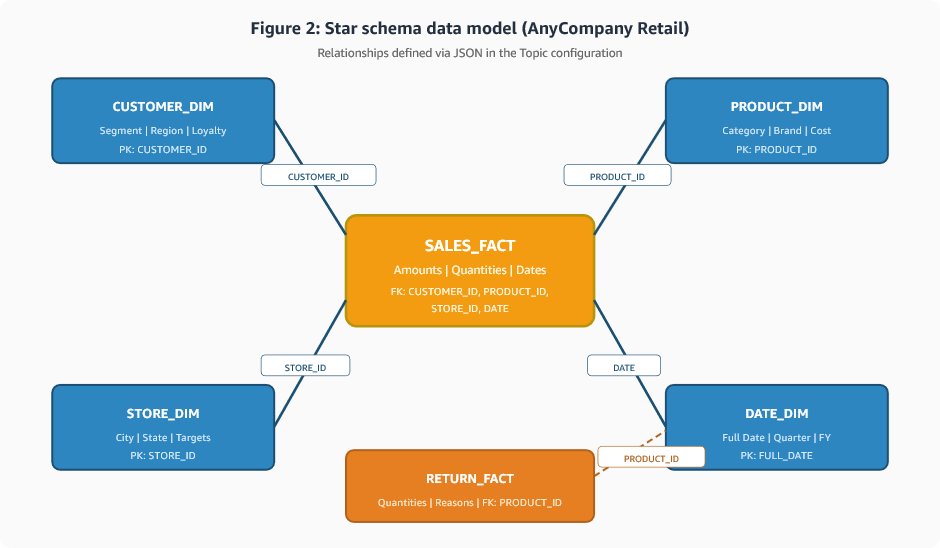
Figure 2: Star schema data model showing SALES_FACT as the central fact table, with dimension tables CUSTOMER_DIM, PRODUCT_DIM, STORE_DIM, and DATE_DIM connected via join keys.
The datasets include:
- SALES_FACT. Transaction-level sales data including amounts, quantities, dates, and foreign keys to dimension tables.
- RETURN_FACT. Product return records with quantities, reasons, and dates.
- CUSTOMER_DIM. Customer attributes including name, segment, loyalty tier, and geographic region.
- PRODUCT_DIM. Product catalog with category, brand, cost, and supplier information.
- STORE_DIM. Store locations with city, state, square footage, employee count, and revenue targets.
Prerequisites
To follow along with this post, confirm you have the following in place:
- An AWS account with Amazon Quick Enterprise Edition enabled.
- Author or Admin role in Amazon Quick.
- Datasets representing a star schema (fact tables and dimension tables), loaded into SPICE or accessible through a supported Direct Query source.
- Permissions to create topics and manage datasets.
- Familiarity with basic data modeling concepts (star schema, fact/dimension tables, join keys).
Create and enrich each dataset
Enrichment bridges the gap between technical column names and how business users actually talk about data. A column named TXN_DT means nothing to a marketing analyst who asks about ‘purchase date’ or ‘order date’. By adding descriptions, synonyms, and semantic types, you teach the NLQ engine your organization’s vocabulary. This investment pays off across every question users ask. It is the foundation that makes multi-dataset Topics accurate rather than only functional.
For each dataset, complete the following:
- From the Quick console’s left pane, under Quick Sight choose Data.
- Select a dataset and choose Edit.
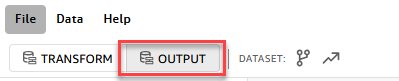
- Select the output tab, and for each column, add descriptions, synonyms, and semantic types.
- Exclude internal or unused fields such as surrogate keys, audit timestamps, and extract, transform, and load (ETL) flags.
- Choose Save and publish.
The following table shows sample enrichment for the STORE_DIM dataset.
| Column | Description | Synonyms | Semantic Type |
| STORE_ID | Unique identifier for each retail store | Store Number, Store Code, Shop ID | Identifier |
| LOCATION | City where the store is located | City, Store City, Town, Area | City |
| REGION | US state where the store operates | State, Territory, Market | State |
| DAILY_TARGET | Expected daily sales revenue target in USD | Daily Goal, Daily Quota | Currency |
| EMPLOYEE_COUNT | Number of employees at the store | Headcount, Staff Count, Team Size | Count |
| STORE_SIZE_SQFT | Retail floor area in square feet | Square Footage, Floor Area | Measurement |
| OPENING_DATE | Date the store first opened | Launch Date, Start Date | Date |
Repeat this process for each dataset. For detailed instructions, refer to Dataset enrichment in the Amazon Quick Sight User Guide.
Create a topic with multiple datasets
With your datasets enriched, create a topic that combines them into a single semantic layer.
- From the Quick console’s left pane, under Quick Sight choose Data.
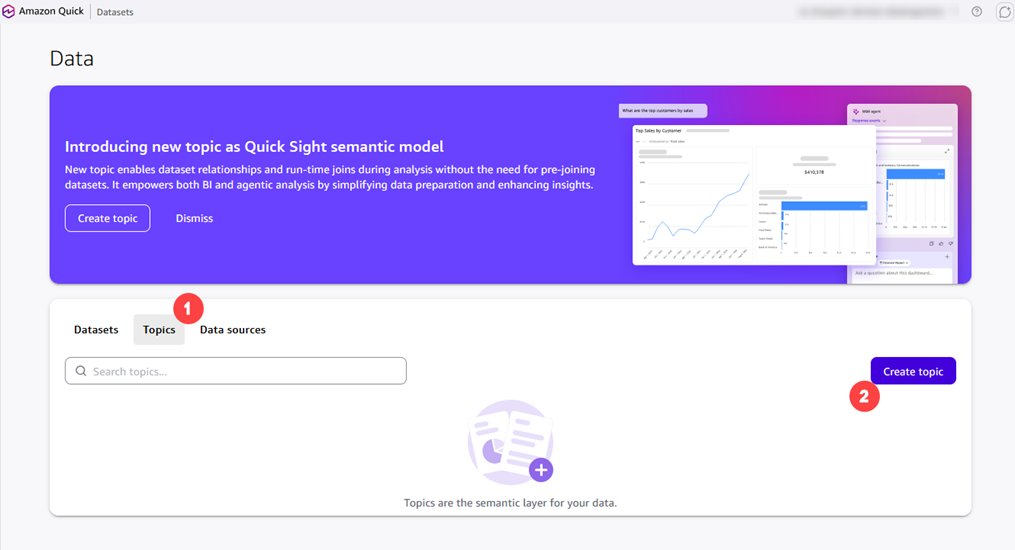
- Navigate to the Topics tab and choose Create topic.
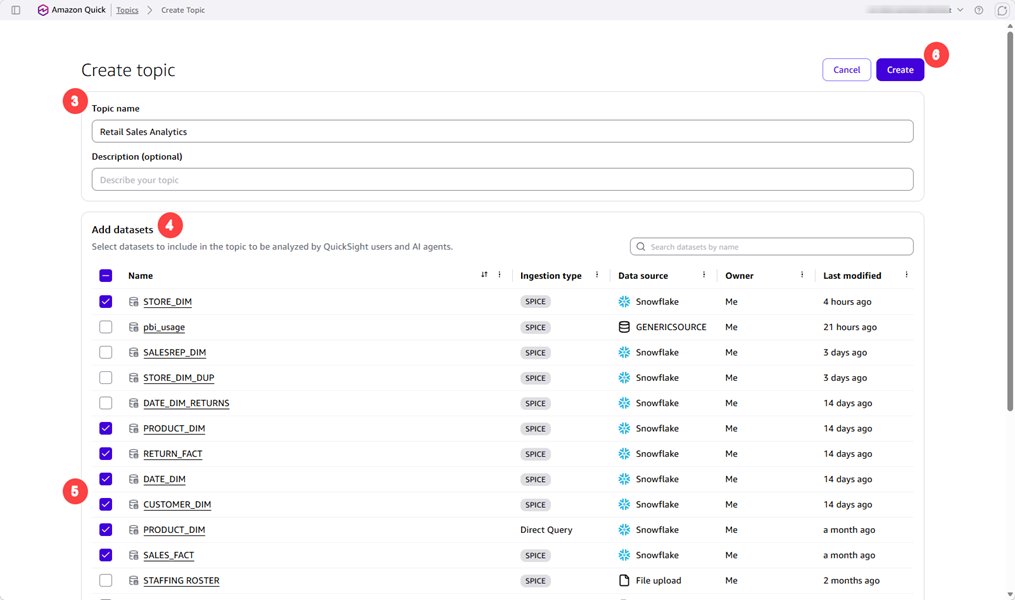
- Enter a topic name (for example, “Retail Sales Analytics”) and a description.
- Choose Add dataset.
- Select all relevant datasets (SALES_FACT, RETURN_FACT, CUSTOMER_DIM, PRODUCT_DIM, STORE_DIM).
- Choose Create.
Define relationships between datasets
Relationships tell the NLQ engine how to join datasets when a question spans multiple tables. You define relationships using a JSON configuration file that specifies join keys between dataset pairs.
- In the topic editor, navigate to the Relationships tab.
- Choose Upload file.
- Upload a JSON file defining your relationships (refer to the following example).
- After uploading, select a join to verify the relationship mapping.
- To edit, choose Edit, update join columns, and choose Save.
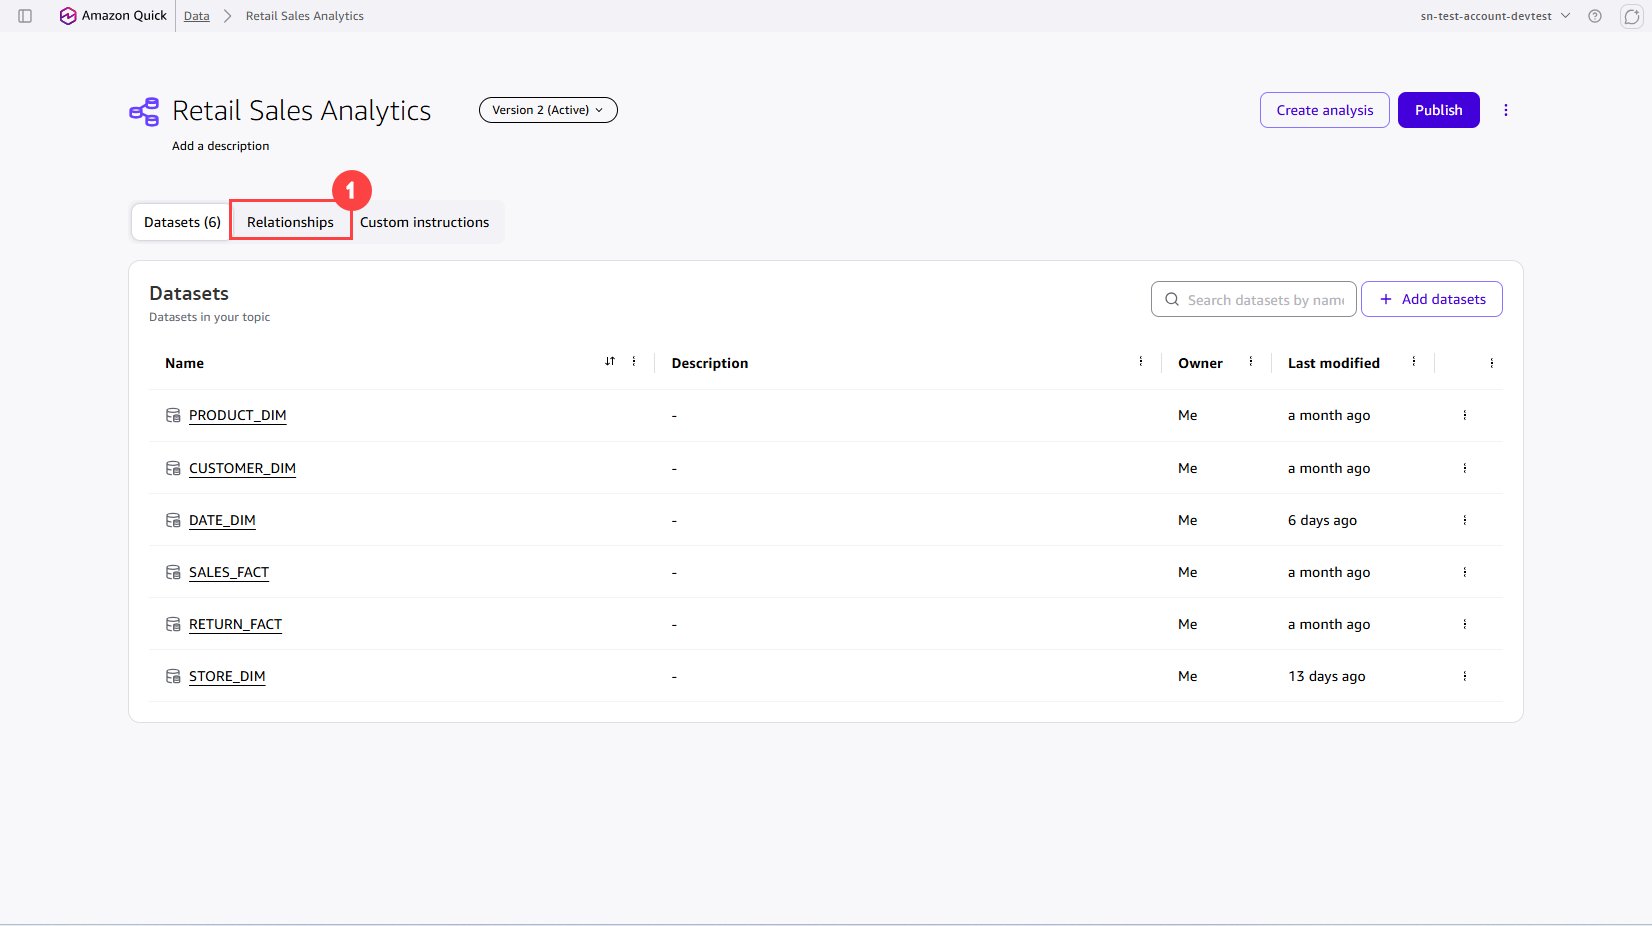
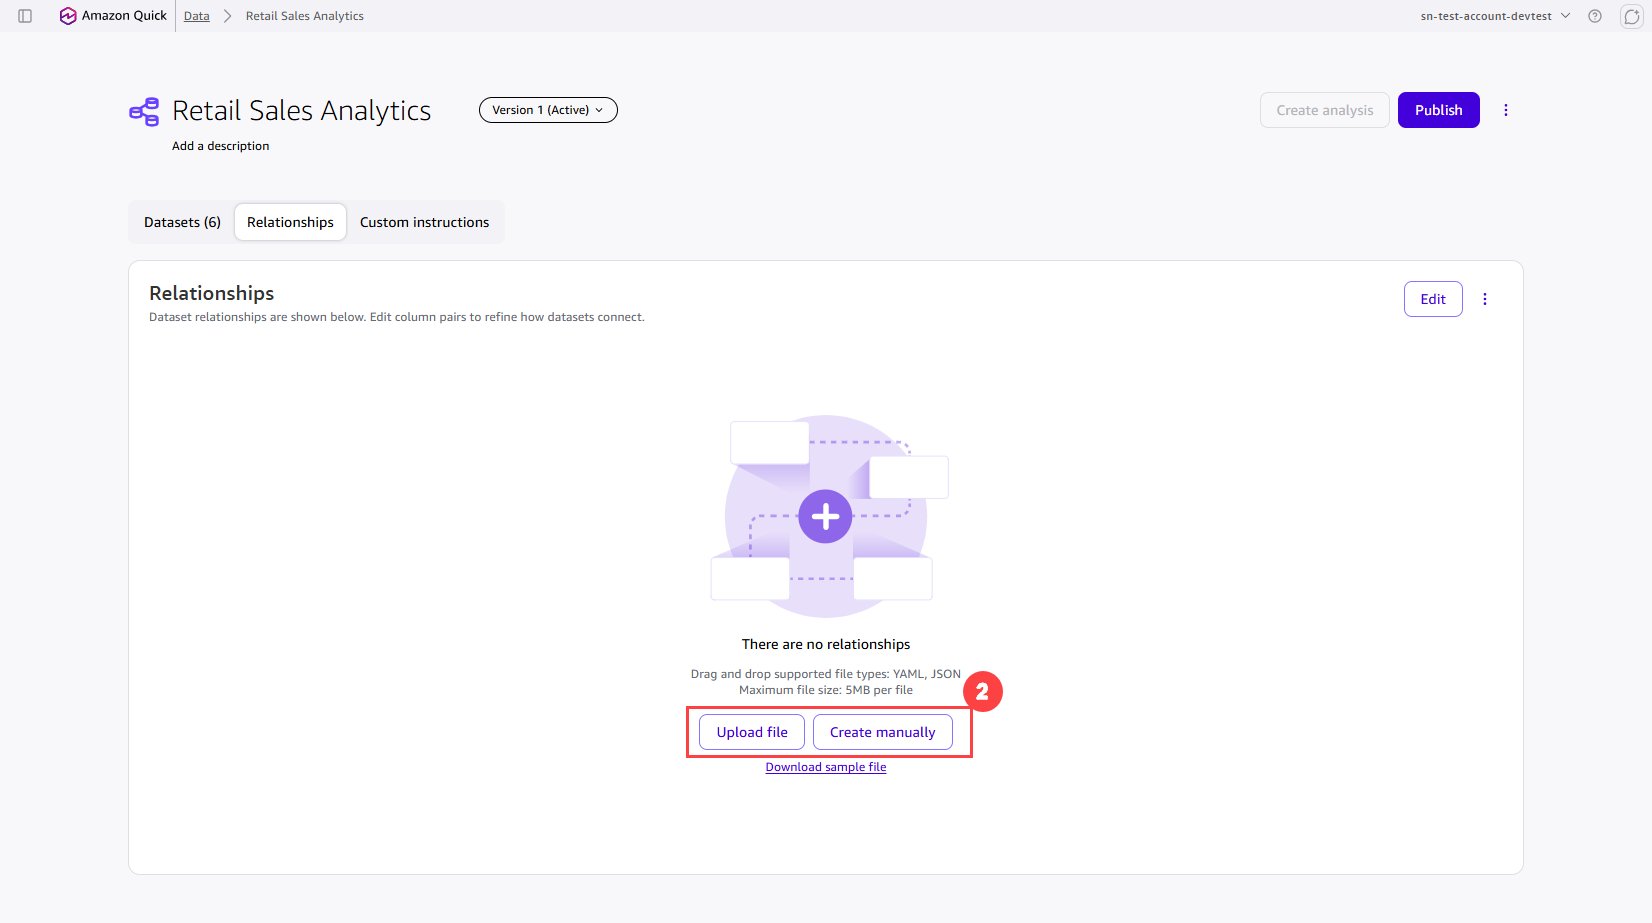
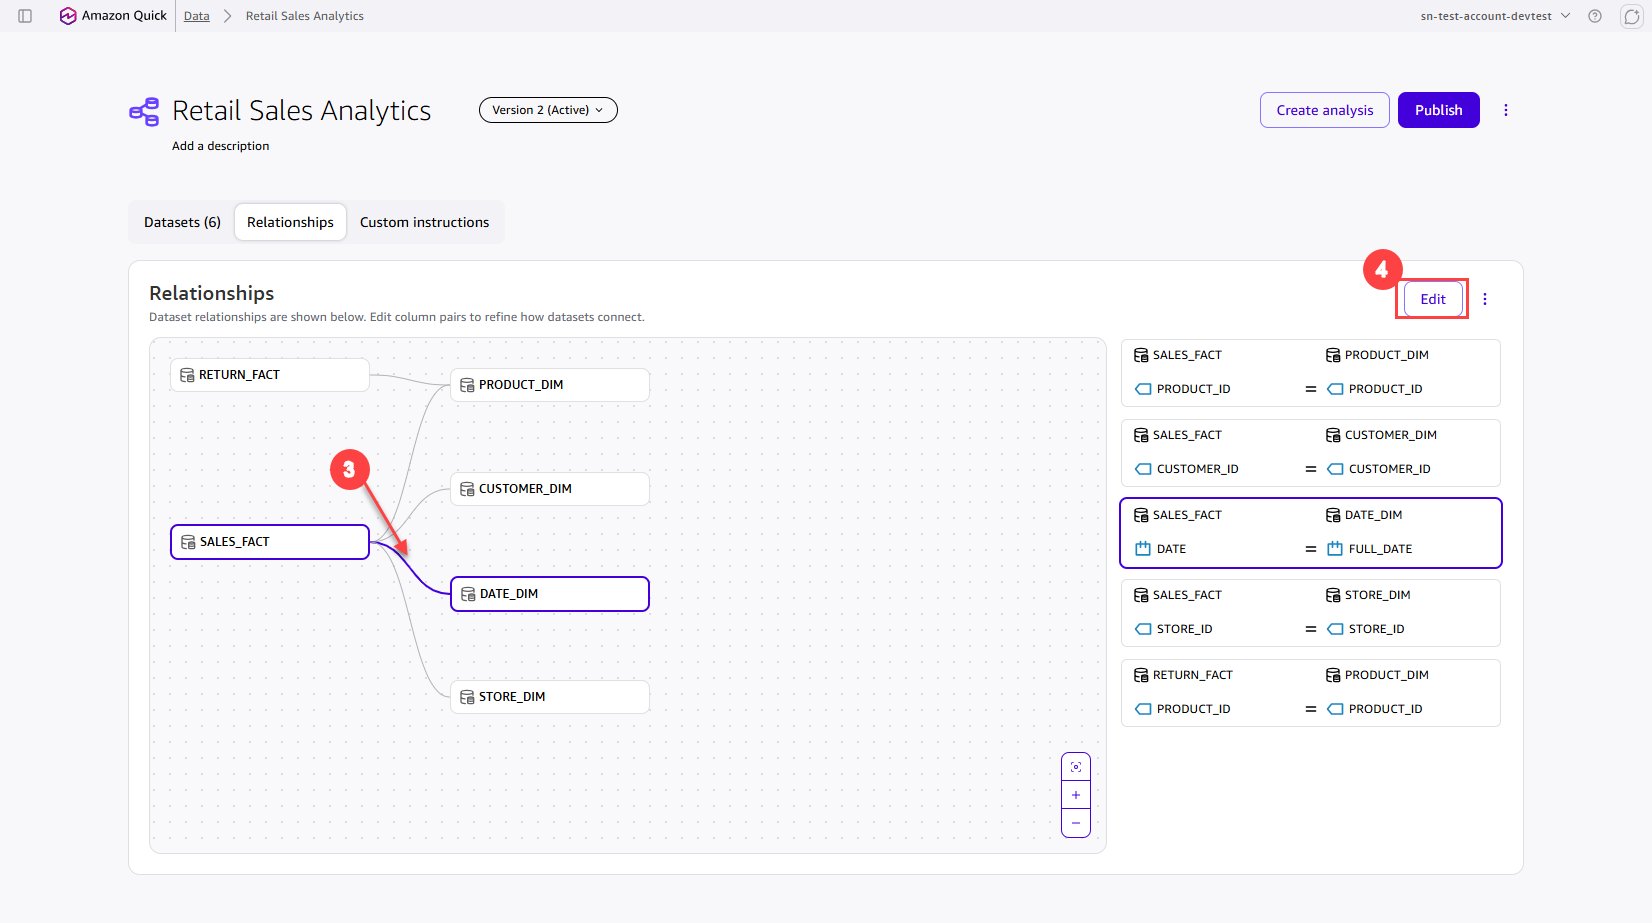
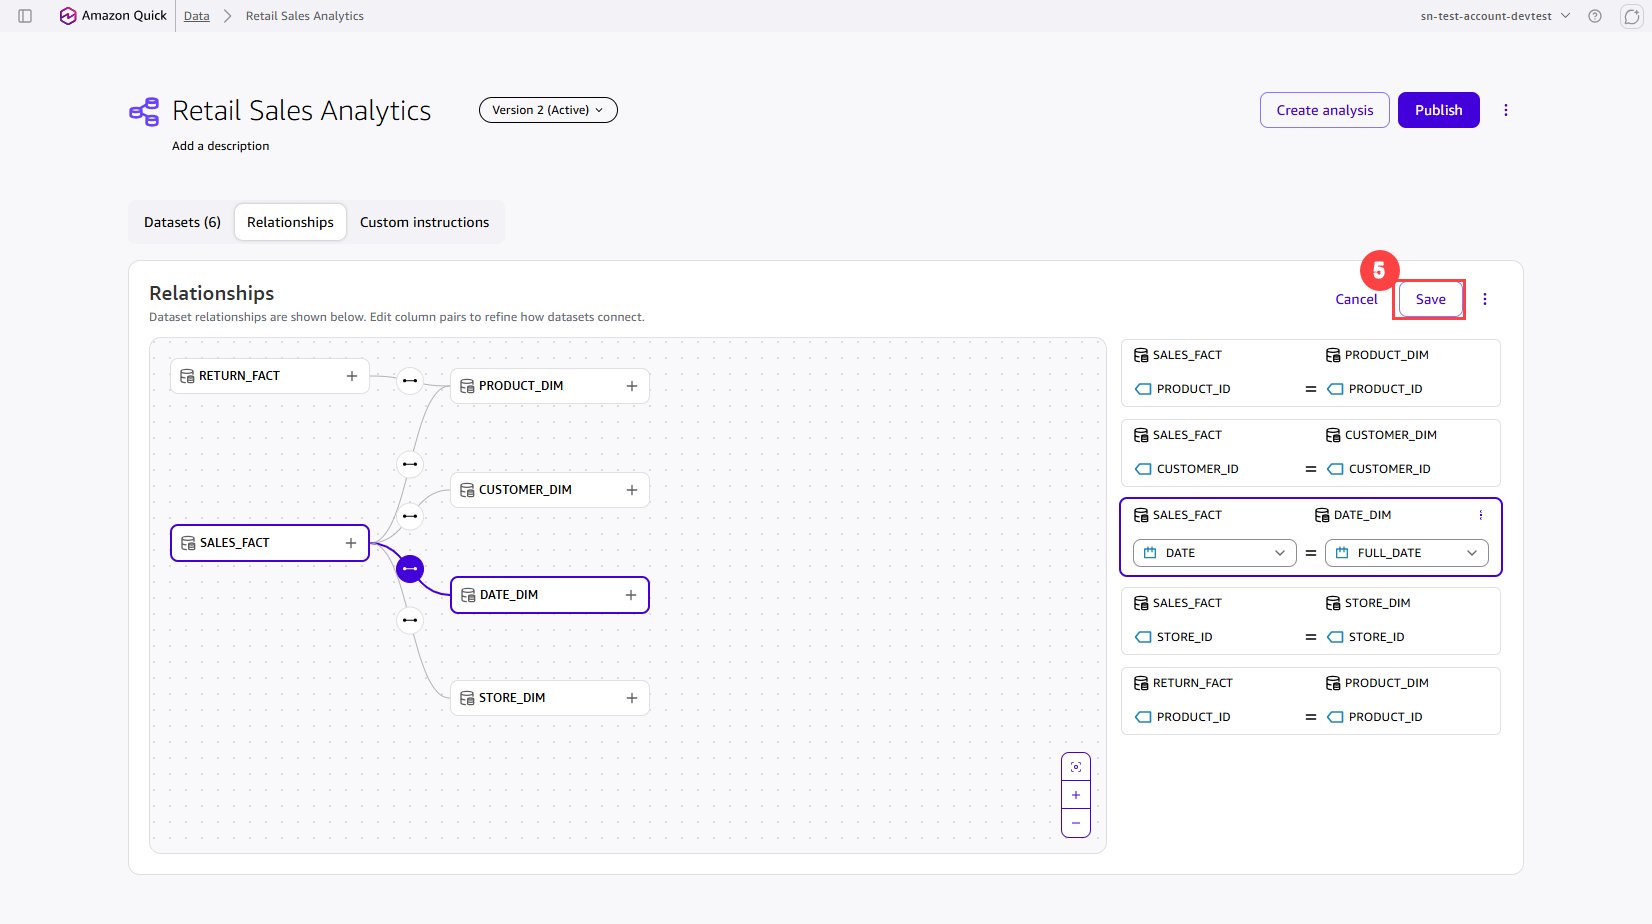
The following JSON shows a star schema configuration of the relationship file:
Best practice: Model your datasets in a star schema with one or more central fact tables joined to shared dimension tables. Avoid circular joins and many-to-many relationships.
Add custom instructions
Custom instructions act as persistent business rules that the NLQ engine applies to every question. Without them, the engine interprets terms literally. For example, ‘this year’ defaults to the calendar year. However, if your organization runs on a fiscal year starting April 1, you need an instruction to override that default. Similarly, business-specific metrics like ‘return rate’ require explicit definitions so the engine calculates them consistently across all users.
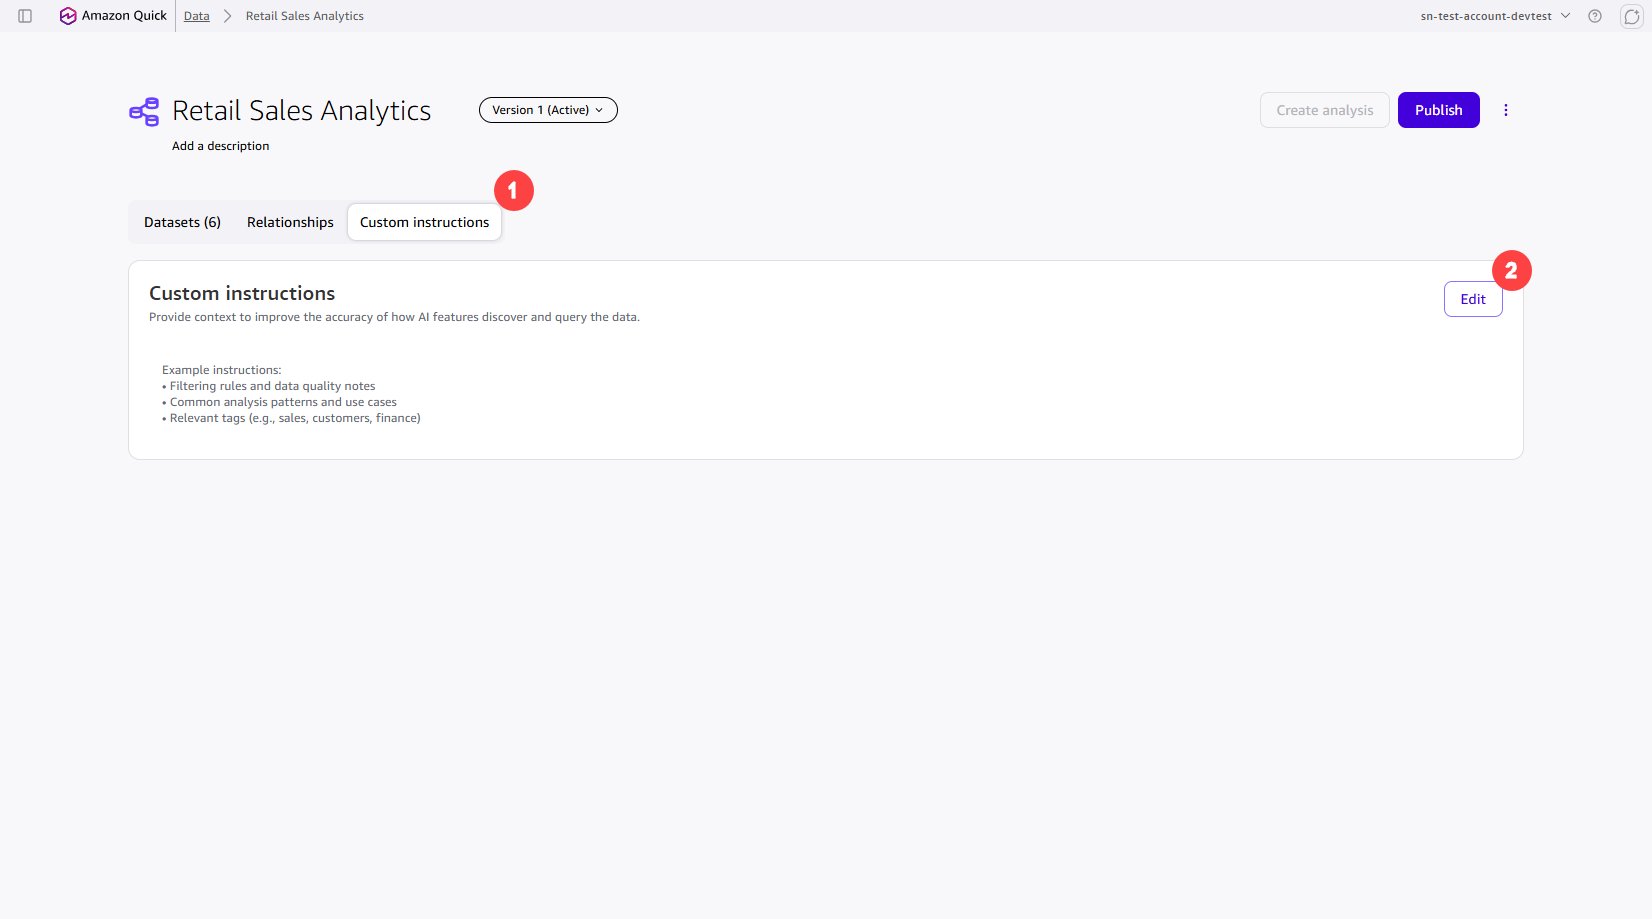
- In the topic editor, navigate to the Custom instructions tab.
- Choose Edit.
- Add your instructions (the following examples).
- Choose Save changes.
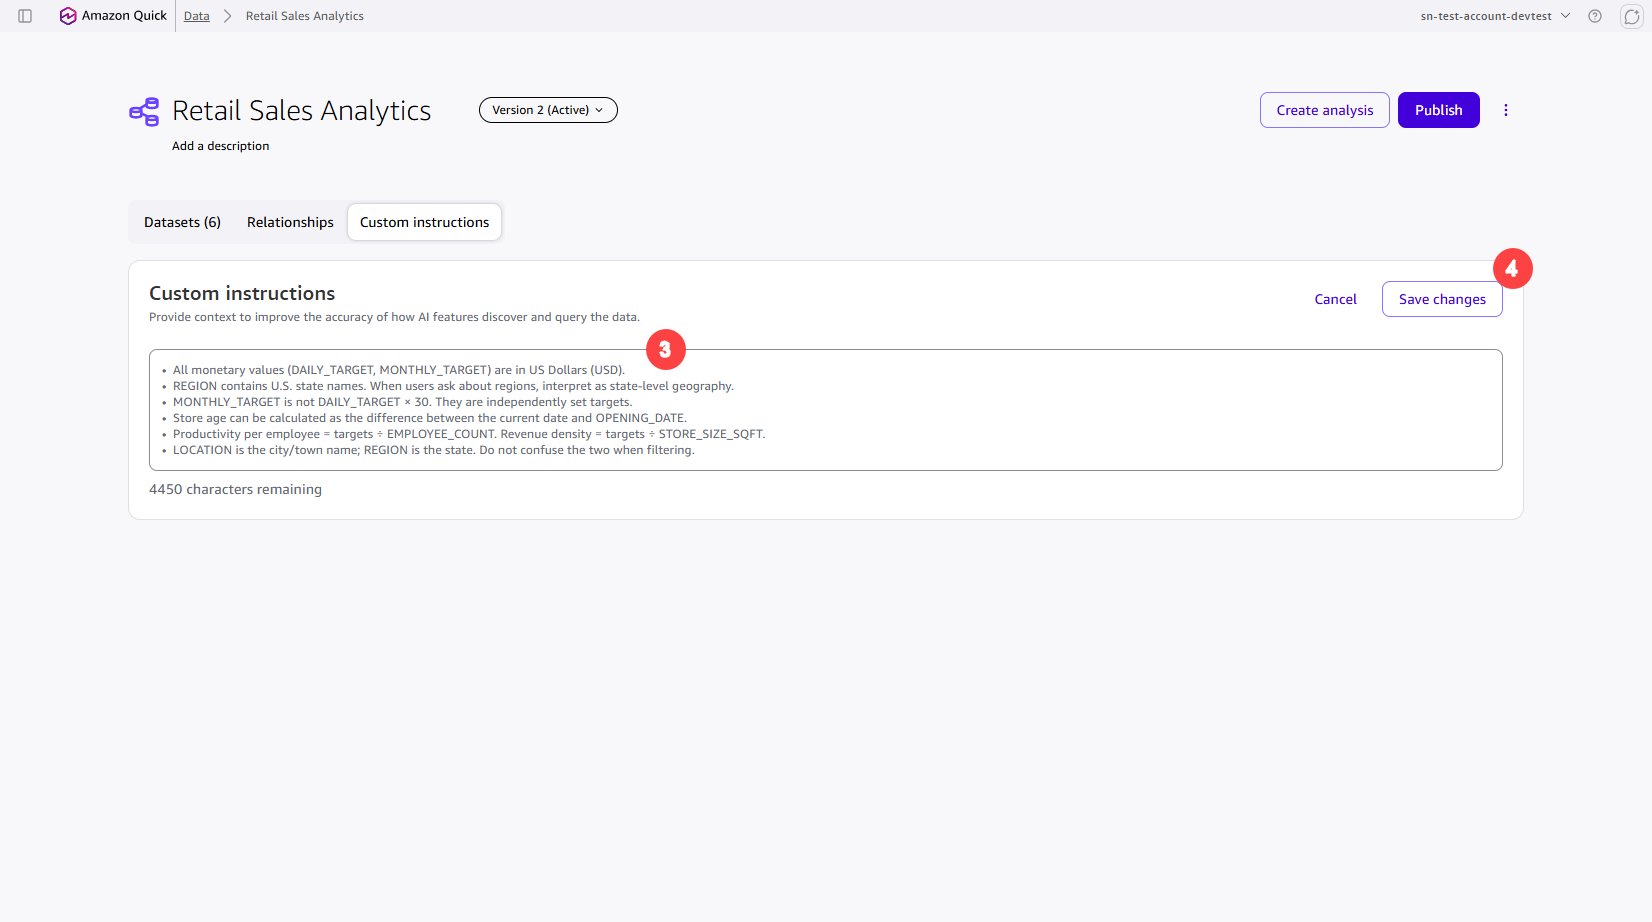
Example custom instructions:
- “Fiscal year starts April 1. Interpret ‘this year’ using fiscal year boundaries.”
- “Active customers means customers with at least one purchase in the last 90 days.”
- “When ‘sales’ is mentioned without qualification, default to
net_sales_amount.” - “Return rate = count of returned items (RETURN_FACT) / total items sold (SALES_FACT), as a percentage.”
Publish and share the topic
After configuring your topic, share it with business users.
- From the topic page, choose Publish, then choose Publish again on the popup.
- From the topic page, select the ellipsis menu and choose Share.
- Search for and add specific users or groups.
- Set permission levels (Owner or Viewer) and choose Done.
| Permission Level | Can Ask Questions | Can Modify Topic | Can use in Analysis |
| Owner | Yes | Yes | Yes |
| Viewer | Yes | No | Yes |
Viewers can immediately start asking natural language questions. Quick Sight enforces row-level security (RLS) and column-level security (CLS) at the dataset level, so access controls are preserved through the topic’s semantic layer.
Use the topic in analysis and chat
Using in analysis sheets
- Navigate to the topic and choose Create analysis.
- Select Interactive sheet and choose Create.
- Select fields from multiple datasets and add them to a visual.
- Create calculated fields that reference columns from different datasets.
Using in chat (NLQ)
- Navigate to the topic and choose the chat icon.
- Your topic is automatically available as the context.
- Ask natural language questions that span multiple datasets:
- “Summarize topic?”
- “Return analysis”
- “Show return rate trend as % of quantity?”
- The chat agent uses your defined relationships, descriptions, synonyms, and custom instructions to generate accurate answers.
- Explore results and explanation. Notice how the SQL shows joins from multiple datasets.
The generated SQL demonstrates multi-dataset joins in action. For example, a question about “sales by region” produces SQL that joins SALES_FACT to STORE_DIM on STORE_ID and groups by the REGION column.
Clean up
To avoid incurring ongoing charges, delete the AWS resources, such as AWS Identity and Access Management (IAM) roles, Quick Sight data sources, and policies, that you created as part of this experimentation. For instructions, see the service documentation.
Conclusion
In this post, you learned how to use multi-dataset Topics in Amazon Quick Sight to build a unified semantic layer across multiple normalized datasets without pre-joining or duplicating data. By defining relationships through join keys, enriching each dataset with semantic metadata, and adding custom instructions, you give the NLQ engine the context it needs to answer cross-dataset natural language questions accurately.
This feature preserves your star schema design, reduces data duplication, and gives administrators a single governed surface to manage business definitions across all related datasets. Business users get richer, cross-domain answers through chat and analysis without understanding joins or SQL.
To get started, create a topic and add your related datasets today. For the full configuration reference, see Working with Amazon Quick Sight Topics in the documentation. For additional discussions and help getting answers to your questions, check out the Amazon Quick Community.
Refer to the Data Modeling Best Practices for Amazon Quick Sight Multi-Dataset Relationships blog post for a detailed look at different scenarios and how to model those using Quick Sight.
About the authors