










Powering scientific discovery: BYOKG and GraphRAG for intelligent pharmaceutical research
In this post, we explore how Graph-based Retrieval Augmented Generation (GraphRAG) is transforming scientific research by combining graph databases with generative AI. With this approach, you can accelerate discovery processes without compromising scientific integrity.
In pharmaceutical research, scientists face a fundamental challenge: accessing and connecting the vast amount of scientific knowledge scattered across disparate systems. From published literature and internal lab notes to genomics databases, critical insights remain trapped in silos, making it difficult for researchers to form comprehensive connections and generate promising hypotheses. This fragmentation slows down the drug discovery process. It also risks valuable institutional knowledge being lost as researchers transition, ultimately affecting the industry’s ability to research and develop efficiently. The need for a solution that can intelligently bridge these knowledge gaps while maintaining scientific integrity has become increasingly important.
The challenge: Scattered data across fragmented systems
At leading pharmaceutical companies, researchers face a critical challenge in early-stage drug discovery, where traditional methods yield only a 5 percent success rate and initial screening takes over six months. Scientists struggle to connect insights buried across fragmented systems such as PubMed, internal lab notes, and genomics databases, all while racing against competitors and time constraints. The scattered nature of data leads to redundant work and missed opportunities. It also makes it difficult to trace the evidence trail needed for regulatory approval. When researchers depart, they often take valuable tacit knowledge with them, further compromising the institutional memory needed for breakthrough discoveries.
Challenges in early-stage drug discovery:
- Poor success rate and time efficiency – Only 5 percent hit rate with over 6 months of screening time per attempt.
- Fragmented knowledge systems – Critical insights scattered across PubMed, lab notes, and databases, leading to missed connections.
- Loss of institutional memory – Valuable knowledge disappears when researchers leave, breaking continuity in research efforts.
These challenges collectively create a significant bottleneck in the drug discovery pipeline, leading to inefficiencies, missed opportunities, and potential delays in developing life-saving treatments. Our solution addresses these bottlenecks by moving beyond traditional methods: graph-powered AI supports pharmaceutical research by creating an interconnected knowledge environment. Using Amazon Neptune Analytics, researchers can now ask complex questions in natural language and receive instant, evidence-backed insights drawn from a unified knowledge graph that connects everything from compound interactions to gene expressions and clinical studies. This approach doesn’t only provide answers. It reveals the complete reasoning behind each result by showing detailed citation paths and graph traversal steps. By exposing how the system navigates through interconnected research papers and data points, it makes scientific discovery more transparent and reproducible.
By combining graph and generative AI, research scientists don’t only retrieve information. They can amplify reasoning, preserve institutional memory, and surface insights that would otherwise stay buried. It also helps them generate better hypotheses, move faster, and trust the outputs, because every insight comes with context and proof. In a field where the cost of delay is measured in both dollars and lives, this shift is more than helpful. It changes how research gets done.
In this post, we explore how Graph-based Retrieval Augmented Generation (GraphRAG) is transforming scientific research by combining graph databases with generative AI. With this approach, you can accelerate discovery processes without compromising scientific integrity.
By integrating Amazon Neptune Analytics for high-performance graph processing with Amazon Bedrock, researchers can build sophisticated systems that not only understand complex scientific relationships but also provide intuitive natural language interfaces. The GraphRAG architecture helps enhance the quality of AI-generated responses by intelligently traversing knowledge graphs to identify relevant information paths. This makes sure that the responses are firmly anchored in verified scientific data.
What makes this solution powerful for scientific research is its ability to understand and connect intricate relationships between entities, from plants and compounds to proteins, genes, and their associated health effects. With this comprehensive understanding, researchers can uncover insights more efficiently and make data-driven decisions with greater confidence.
Solution overview
The solution reimagines the research process through a Bring Your Own Knowledge Graph (BYOKG) approach enhanced with GraphRAG capabilities. A knowledge graph is a structured representation of information that shows relationships between different entities as a network of interconnected nodes and edges. Powered by Amazon Neptune, it integrates diverse scientific entities (plants, compounds, genes, proteins, and health effects) into a unified knowledge network that bridges data from public sources like PubMed and Gene Ontology with proprietary datasets. Automated ingestion pipelines and graph algorithms continuously enrich the graph, helping researchers uncover complex biological relationships and insights that were previously hidden across disconnected data silos.
Using Neptune Analytics and Amazon Bedrock, the solution combines graph algorithms with natural language querying to make scientific exploration both analytical and intuitive. Researchers can ask complex questions in plain English and receive evidence-based answers derived from graph traversal, complete with source citations and visual pathways. Interactive visualization tools further help enhance transparency and understanding, allowing users to explore relationships, trace hypotheses to conclusions, and validate results with clear, verifiable evidence. This accelerates discovery and strengthens scientific rigor across domains.
Solution architecture
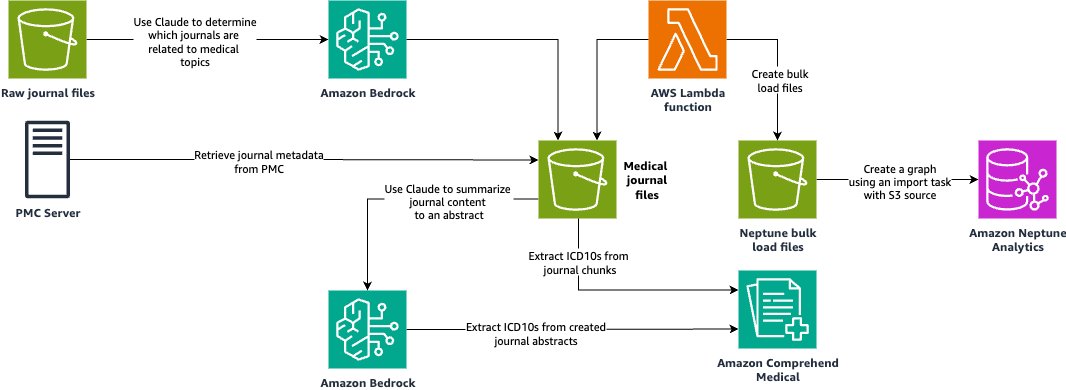
Our solution helps researchers quickly discover relevant medical journal articles across conditions and topics. The dataset includes the HCLS journal articles provided by the PMC Open Access Subset licensed with CC BY and CC0 licenses, journal metadata provided by the National Center for Biotechnology Information (NCBI) via the Bio.Entrez package, Disease Ontology hierarchies, and ICD10 codes that have been extracted using the ICD-10-CM linking API within Amazon Comprehend Medical. Although the final dataset is provided to you, the following architecture depicts the flow used to create the dataset.
The following diagram illustrates the loading of the data to Amazon Neptune Analytics using services like Amazon Bedrock and Amazon Comprehend to extract data from medical journals.
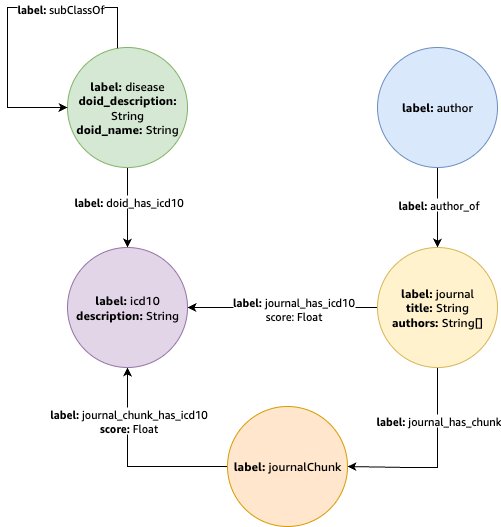
The following image represents the final graph, which contains these node types:
- disease: Represents a disease within the Disease Ontology. The Disease Ontology provides a mapping to help us understand which diseases are subclasses of other diseases.
- author: Represents an author of a particular journal.
- journal: Represents a journal.
- journalChunk: Represents a chunk of a given journal. Chunks were determined using the default chunking strategy provided through Amazon Bedrock Knowledge Bases.
- icd10: Represents an ICD-10 code, which is a standardized classification of medical issues. Edges between
icd10nodes andjournalandjournalChunknodes were created using the Amazon Comprehend Medical ICD-10-CM linking.
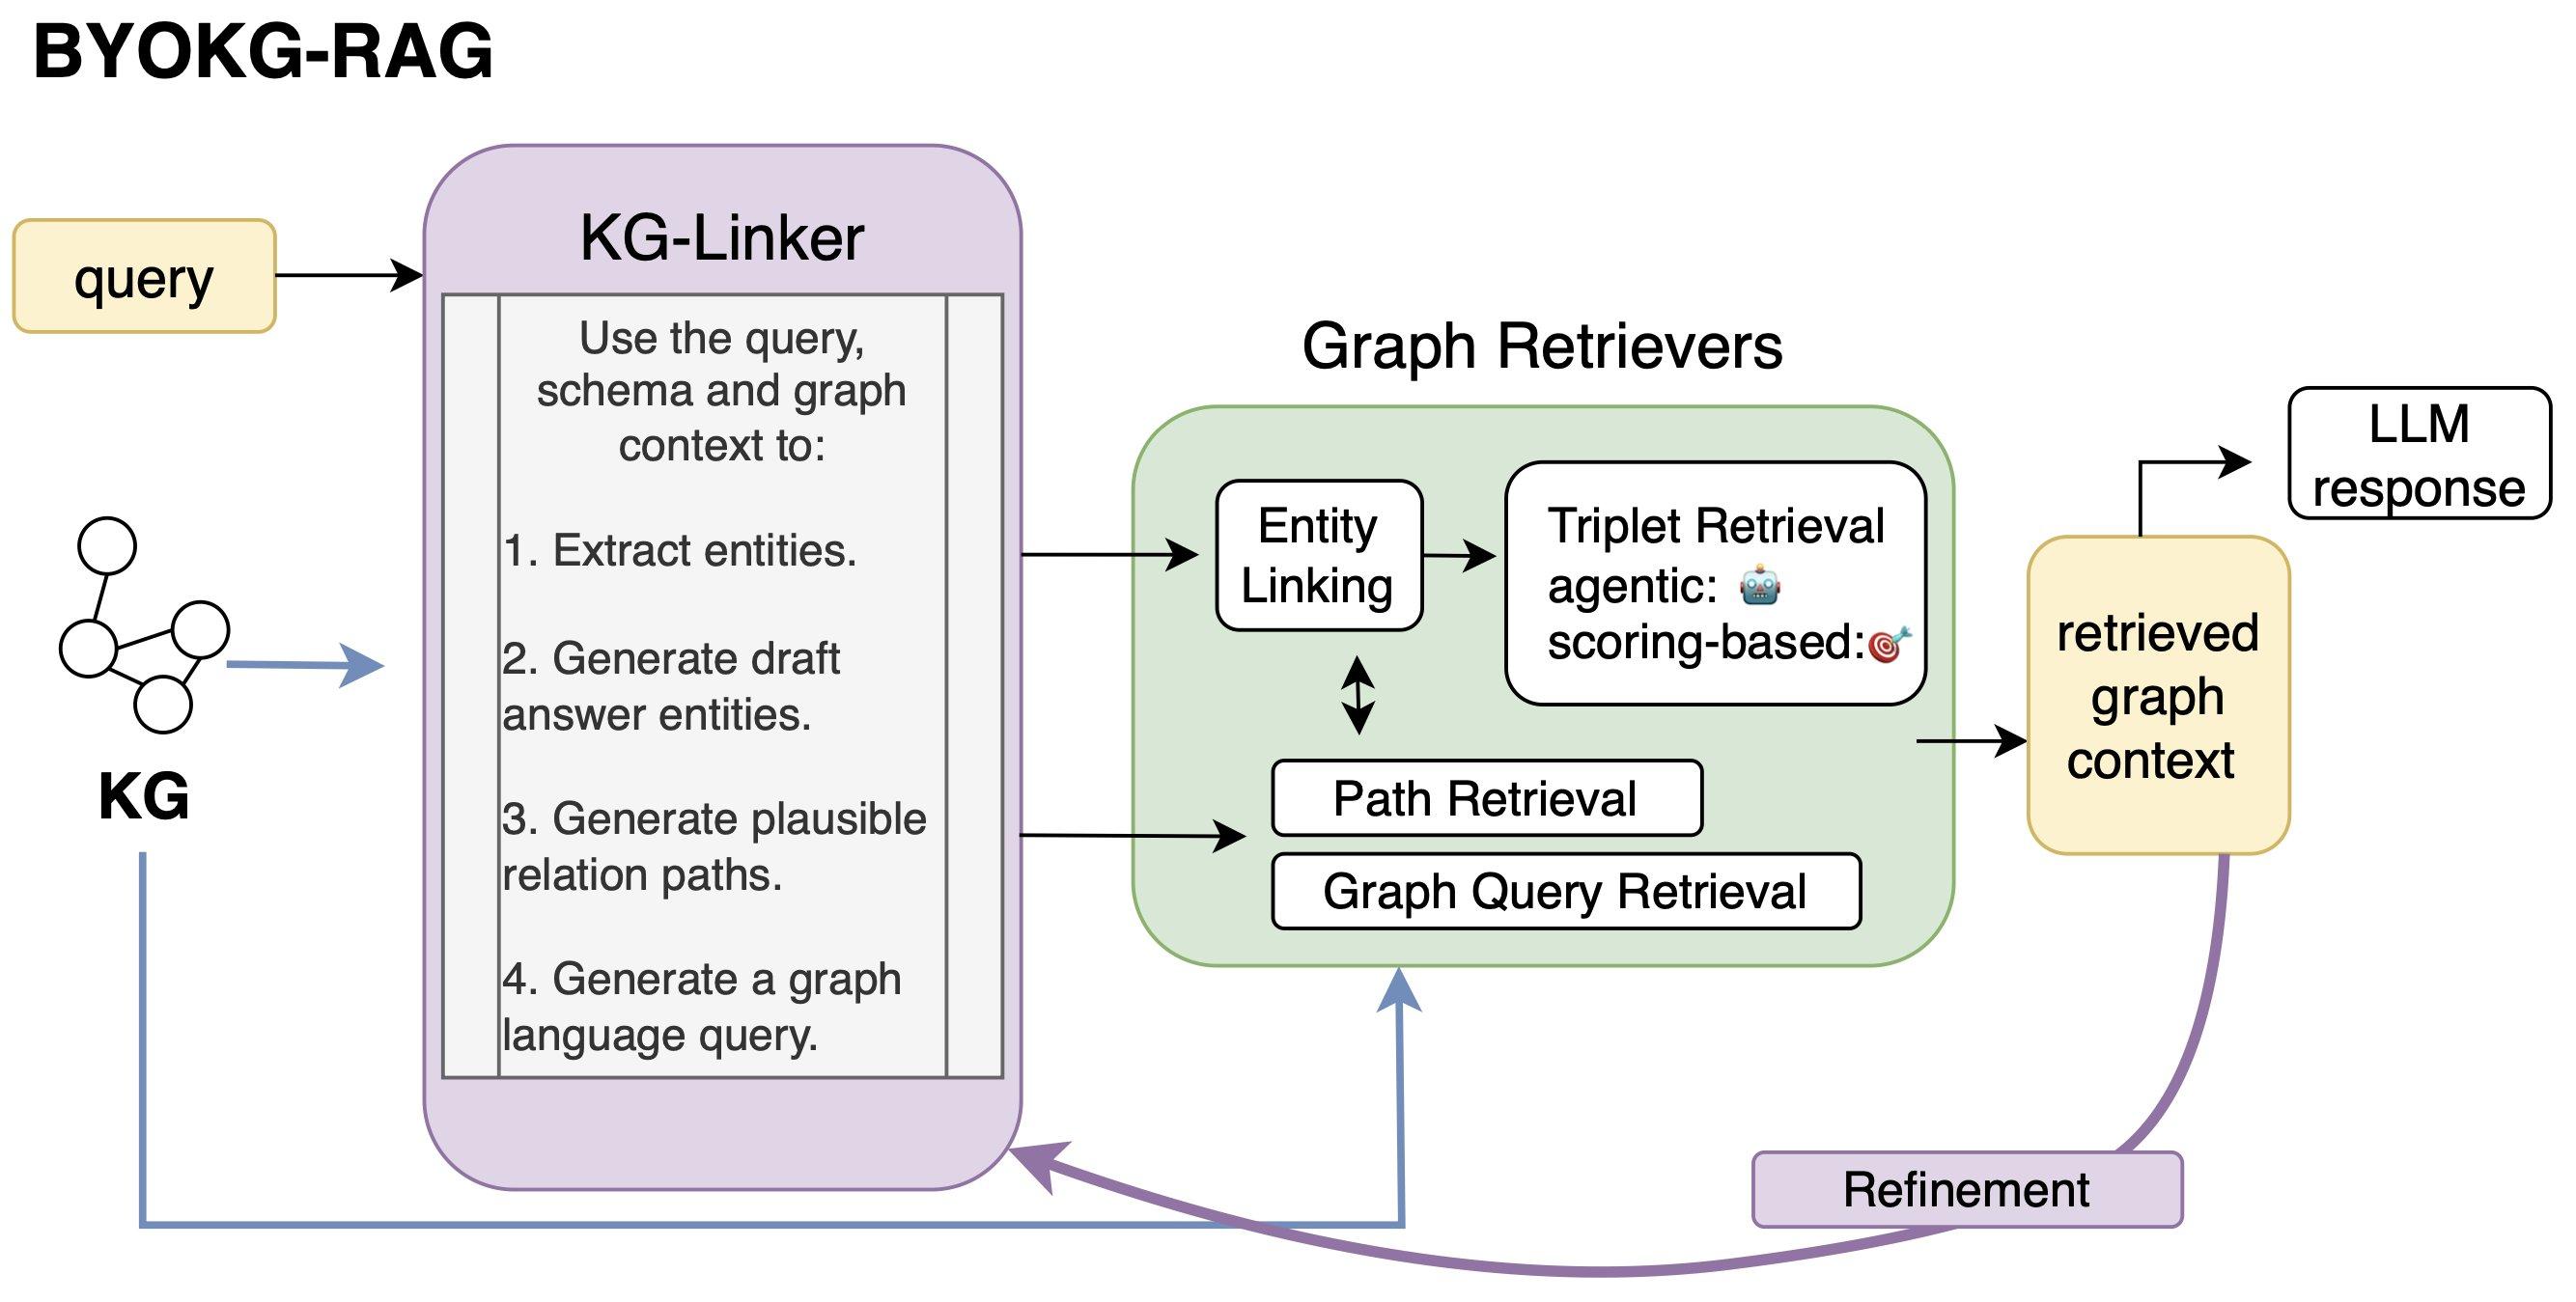
Because we’re using our own graph data model, we use the BYOKG-RAG toolkit to implement natural language querying over the graph. The following diagram illustrates the components of BYOKG.
Prerequisites
Before getting started, make sure you have the following prerequisites:
- AWS Command Line Interface (AWS CLI) version 2.11.0 or later installed and configured (installation guide)
- Access to the following AWS services:
- Amazon Neptune Analytics
- Amazon Bedrock (Claude 4.5 Sonnet model)
- Amazon SageMaker
- Amazon Simple Storage Service (Amazon S3)
- Amazon Comprehend Medical
- IAM role with the following permissions:
- NeptuneAnalyticsFullAccess
- AWSServiceRoleForAmazonNeptuneAnalytics
- AmazonS3ReadOnlyAccess
- AmazonBedrockFullAccess
- ComprehendMedicalFullAccess
- Python 3.9 or later
- graphrag_toolkit version 1.0.0 or later
- Jupyter Notebook environment
Solution cost overview
Cost approximation (per hour) for running this demo:
- Neptune Analytics graph, 16 mNCU, no standby, public connectivity – $0.48/hour.
- SageMaker Jupyter notebook, t3.medium with 5 GB of EBS volume – $0.05/hour for compute plus $0.70/hour for storage.
- S3 storage, standard, 161 MB – 0.161 GB × $0.023 = $0.0037 per month.
- Amazon Bedrock – The cost for Amazon Bedrock depends on model usage and token consumption. For the most up-to-date information, see the pricing page.
Setting up Neptune Analytics
Let’s begin implementing your GraphRAG solution by setting up Neptune Analytics. The following steps will guide you through data import, graph creation, and notebook configuration to build your knowledge graph foundation:
- Create an S3 bucket:
aws s3 mb s3://amzn-s3-bucket-name. - Copy the dataset into your own buckets using the AWS CLI:
- Create a Neptune Analytics graph using the
CreateGraphUsingImportTaskAPI to import from the Amazon S3 location you copied to in the first step. For details on how to do this, see the Neptune Analytics User Guide. Set the minimum and maximum provisioned memory to 16. - While the graph is creating, create a Neptune Notebook associated with the graph. The notebook makes it straightforward to query and interact with the graph, as well as set up and run the GraphRAG Toolkit. For details on how to create a Neptune Notebook, see the Neptune Analytics User Guide.
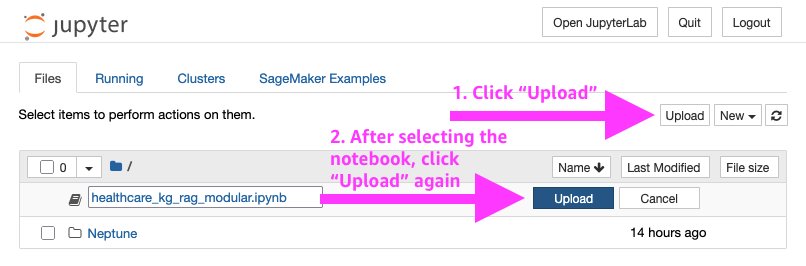
- Download the sample notebook, and upload it to your Jupyter environment.
Implementation steps: Building a modular GraphRAG system with the GraphRAG Toolkit and Amazon Bedrock
In this notebook, we demonstrate a modular approach to building a Retrieval Augmented Generation (RAG) system over a healthcare knowledge graph, using the graphrag-toolkit Python package and the Amazon Bedrock Anthropic Claude 4.5 Sonnet model. This solution supports natural language querying and entity linking within a knowledge graph, combining advanced language model generation with structured graph data retrieval.
Key components
- Language model initialization
We begin by initializing the Amazon Bedrock-based language model generator that powers our natural language responses.
- Knowledge graph linker setupThe
KGLinkeris initialized by passing the graph store and the language model generator. It acts as the core interface to query the graph and generate answers.
- Generating responses from queries
With thekg_linker, we can pose natural language questions and obtain generated responses augmented by the knowledge graph context.
- Entity linking for enhanced retrieval
To improve information extraction and link natural language text to graph entities, we use a fuzzy string index combined with theEntityLinker.
Summary
This modular structure cleanly separates the following components:
- Large language model (LLM) initialization (using Amazon Bedrock).
- Knowledge graph interfacing (
KGLinker). - NLP (natural language querying).
- Entity linking on graph nodes.
The modular structure allows flexible experimentation and straightforward extension for different domains or datasets.
The integration of a fuzzy string matcher facilitates robust entity recognition, which is important in noisy or complex healthcare data contexts.
By combining the Amazon Bedrock advanced language models with structured graph querying and linking, this solution forms a powerful foundation for context-aware question answering and information retrieval over knowledge graphs.
Solution benefits and performance metrics
The following key performance indicators from our implementation of the solution demonstrate how this GraphRAG solution can create measurable value and competitive advantage for pharmaceutical research organizations:
- Research timeline acceleration – GraphRAG reduces research cycles from six months to three weeks, delivering an 87 percent efficiency boost. This supports rapid hypothesis testing and faster scientific breakthroughs.
- Success rate optimization – GraphRAG reduced research cycles in our implementation from six months to three weeks. The solution is powered by advanced graph algorithms. Cross-domain analysis facilitates more effective research directions and optimal resource deployment.
- Workflow efficiency gains – Key metrics show measurable improvements in our tests: 70 percent reduction in review time, 85 percent faster data access, and 90 percent enhanced knowledge use. Teams can focus on strategic research priorities.
- Data-driven validation – Advanced tracking and visualization facilitate full research transparency. Clear data pathways strengthen regulatory compliance and improve scientific communication.
- Intelligent knowledge integration – The system efficiently scales and integrates new data sources with minimal resource impact. Enhanced collaboration preserves vital institutional knowledge.
- Industry leadership enablement – Accelerated innovation cycles maintain scientific rigor while speeding industry entry. This helps create sustainable competitive advantages and industry leadership positions.
Clean up
To avoid incurring additional charges, clean up the resources created in this post.
- Delete the Neptune Analytics graph by following these steps or by running the following CLI command.
Note: Replace g-sample with the graph created.
aws neptune-graph delete-graph --graph-id g-sample - Delete the graph notebook created in the AWS Management Console by selecting the instance, choosing the Actions menu, and selecting the Delete option.

- Delete the S3 bucket created by following these steps or by running the CLI command.
Note: Replace amzn-s3-bucket-name with the name of the bucket created.
aws s3 rb s3://amzn-s3-bucket-name --force
Conclusion
The integration of GraphRAG technology with Amazon Neptune Analytics and Amazon Bedrock represents a significant advancement in scientific research methodology. Researchers can now connect previously siloed data sources, interact with complex datasets using natural language queries, and visualize intricate relationships. This solution can deliver immediate, measurable impact for research organizations by reducing research cycle times by up to 87 percent and increasing discovery hit rates five-fold. It not only accelerates the pace of discovery but also helps enhance the quality and credibility of scientific findings. This solution supports rapid scientific advancements, potentially leading to outcomes that were unattainable within traditional research timeframes. Organizations that adopt generative AI solutions are not only improving their research processes. They are positioning themselves at the forefront of scientific innovation, ready to tackle the most complex challenges of our time with greater speed and accuracy.
About the authors