





















Build visibility for Codex on Amazon Bedrock with OpenTelemetry and Amazon CloudWatch
As engineering teams adopt coding agents like Codex, leaders need visibility into adoption, consumption, and reliability. This post shows how to route Codex OpenTelemetry metrics through a local collector to Amazon CloudWatch for an AWS native view of usage by user, team, and cost center.
As organizations move from experimenting with coding agents to adopting them across engineering teams, the leadership question changes. It is no longer only, “Can this tool help a developer?” It becomes, “How do we understand adoption, manage consumption, maintain reliability, and scale access responsibly?”. Codex can emit OpenTelemetry (OTel) metrics about its activity. When local Codex clients use OpenAI models through Amazon Bedrock and authenticate with AWS IAM Identity Center, you can route those metrics through a local OTel collector to Amazon CloudWatch. The result is an AWS native view of Codex usage that can be organized by user, team, department, organization, or cost center.
This approach does not add a centralized proxy to the model-request path. Developers continue to use Codex locally. A collector running on each developer workstation receives metrics on the local host and enriches them with organizational context. It then sends them to the regional CloudWatch OpenTelemetry Protocol (OTLP) endpoint using AWS Signature Version 4 (SigV4). The reference deployment creates a CloudWatch dashboard, not an Amazon Elastic Container Service (Amazon ECS) service, load balancer, virtual private cloud (VPC), or public ingestion endpoint.
In this post, we explain how this pattern supports governed adoption, review its architecture, and summarize the implementation in the Codex on AWS guidance repository.
Turn telemetry into business decisions
Telemetry is most useful when it answers a decision, not simply when it produces another dashboard. The bundled CodexOnBedrock dashboard includes rolling 24-hour totals for active users, conversation turns, API requests, and token usage. It also provides views by model, token type, user, department, team, cost center, organization, and session source.
These signals can help technology leaders distinguish broad adoption from isolated experimentation. For example, an increase in active users across several teams suggests a different enablement need than high consumption concentrated among a small group. Tool-call activity can help teams see where agentic workflows are taking hold. Request and duration metrics can support investigation of degraded experiences.
| Executive question | Available signal | Decision it can inform |
| Is Codex adoption expanding? | Active users, threads, turns, and API requests | Whether to expand a pilot or focus on onboarding |
| Where is consumption concentrated? | Tokens by user, model, department, team, and cost center | Where to apply showback, review usage, or adjust enablement |
| Are teams using agentic capabilities? | Tool-call volume and session source | Where workflow guidance or system investment might help |
| Is the developer experience reliable? | API status, request duration, and end-to-end turn duration | Whether to investigate model access, networking, or client behavior |
| What did the service cost? | AWS Cost and Usage Reports (CUR) 2.0 with IAM principal data | Billing-grade financial reporting and allocation |
The distinction in the last row is important. CloudWatch OTel metrics show usage volume and operational behavior. Token counts can support trend analysis, but they are not a billing ledger. List-price estimates can diverge from actual charges because of pricing changes, discounts, credits, and billing adjustments. For realized spend, use IAM principal cost allocation from AWS Cost and Usage Reports (CUR) 2.0 or the applicable Amazon Bedrock cost-management reports.
Solution overview
The architecture uses the same AWS identity for model access and telemetry publishing. A developer signs in through IAM Identity Center and runs Codex with Amazon Bedrock as the model provider. Codex sends metrics to a collector listening only on 127.0.0.1. The collector adds identity and organizational attributes, batches the metrics, and signs requests to CloudWatch with temporary AWS credentials.
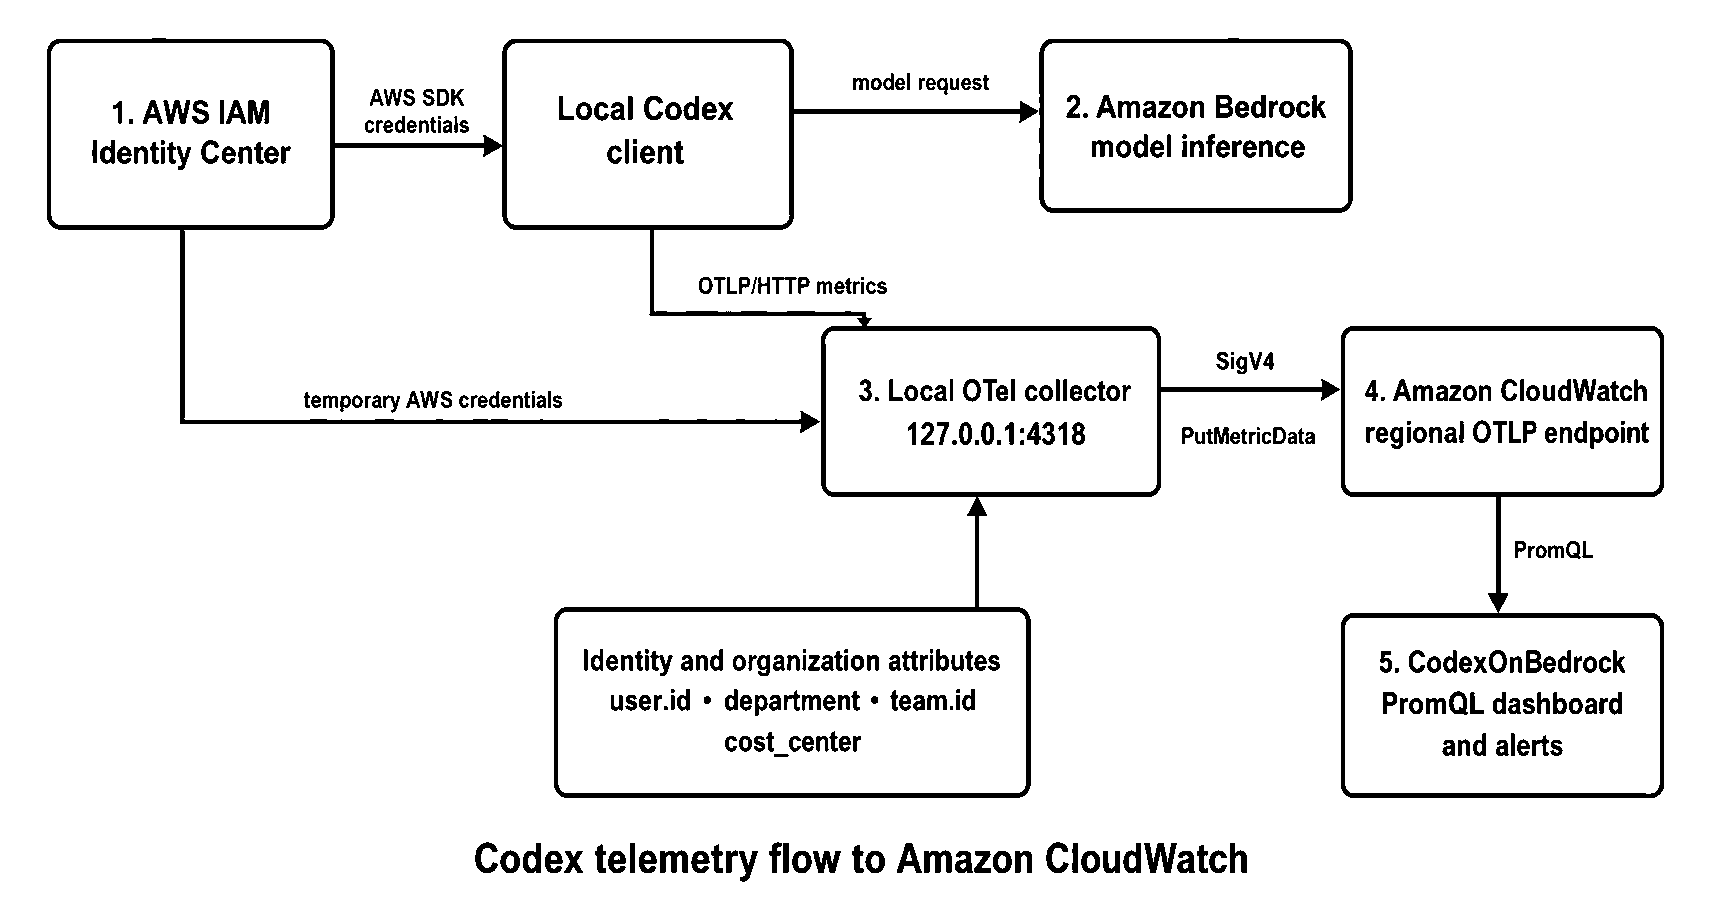
Local Codex telemetry flow to Amazon CloudWatch through a local collector that publishes metrics with SigV4 authentication and stays out of the Amazon Bedrock inference path
Codex emits metrics such as codex.api_request, codex.api_request.duration_ms, codex.turn.e2e_duration_ms, codex.turn.token_usage, codex.turn.tool.call, codex.thread.started, and codex.conversation.turn.count. The current Codex configuration documentation describes OTel as opt-in and documents separate exporters for logs, metrics, and traces.
The local collector adds user.id and user.email as required resource attributes. Optional attributes include department, team.id, cost_center, organization, location, role, and manager. The reference collector copies these attributes onto each metric datapoint as well. This approach gives the dashboard consistent Prometheus Query Language (PromQL) groupings across the local sidecar and other supported ingestion patterns.
Implement the reference pattern
The complete commands and templates are in the native AWS access quickstart. The following five stages summarize the implementation.
1. Enable the CloudWatch OTel capabilities
The reference runbook begins by enabling OTel enrichment and resource tags for telemetry in the target Region:
The current CloudWatch OTel documentation describes native OTLP ingestion and PromQL querying. The start-otel-enrichment operation enables enrichment and PromQL access for supported AWS vended metrics. The start-telemetry-enrichment operation enables resource-tag enrichment. Confirm which account-level settings are already enabled before changing them.
2. Deploy the dashboard and build the collector
Clone the repository, then deploy the dashboard and obtain the collector binary:
The AWS CloudFormation stack deploys the CodexOnBedrock dashboard. The collector runs on developer workstations, so this step does not create centralized collector compute or networking infrastructure.
3. Generate per-developer configuration
Generate the collector configuration from the developer’s authenticated AWS profile:
With --auto-lookup, the script can read organizational attributes from the IAM Identity Center identity store. Explicit command-line values can override discovered values. If an optional attribute is unavailable, omit its entire configuration block. Do not send placeholder strings as dimensions. They create low-value series and weaken reporting quality.
For a fleet rollout, generate and distribute this configuration through your existing endpoint-management process. Treat organizational metadata as governed data: establish approved values, ownership, and update procedures before using it for executive reporting.
4. Configure Codex and grant least-privilege access
Point the Codex metrics exporter to the local collector. Include the full /v1/metrics path because Codex does not append it:
The collector forwards metrics to the regional CloudWatch OTLP metrics endpoint, such as https://monitoring.us-west-2.amazonaws.com/v1/metrics. SigV4 is the recommended authentication method for short-term AWS credentials. The publishing identity requires cloudwatch:PutMetricData. No log-group or ECS permissions are required for this metrics path.
Retain log_user_prompt = false. This design is intended to measure operational and adoption signals, not collect source code or prompt content.
5. Validate the complete flow
Start the service-specific collector with the generated configuration, run a Codex task, and then open the CodexOnBedrock dashboard in the CloudWatch console. You can also use CloudWatch Query Studio or the repository’s check-otel-pipeline.sh script to confirm that codex.turn.token_usage is arriving.
Codex metrics flush periodically and on a clean process exit. The reference runbook documents a 60-second interval and suggests OTEL_METRIC_EXPORT_INTERVAL=1000 as an optional safeguard for error paths that might skip the exit flush. If no metrics appear, also confirm that managed configuration has not set [analytics] enabled = false, because that setting disables the Codex metrics pipeline.
Operate with governance in mind
The same dimensions that make the dashboard useful can create privacy and governance concerns if they are exposed too broadly. Use aggregated team, department, and cost-center views for executive reporting. Restrict per-user dashboards to approved system, operations, security, or finance roles, and align access with employee-monitoring and data-retention policies.
Control metric cardinality as you scale. Standardize attribute names and values, omit fields that do not support a defined decision, and avoid adding project names or ephemeral identifiers without a retention and query plan. CloudWatch OTel metrics use per-gigabyte ingestion pricing, and PromQL queries are priced according to samples scanned. Review the current CloudWatch OTel pricing documentation and Amazon CloudWatch Pricing before a broad rollout.
This pattern provides visibility and soft controls. You can use CloudWatch alarms and Amazon Simple Notification Service (Amazon SNS) notifications to alert when a user or team crosses a defined usage threshold. However, IAM Identity Center issues temporary credentials directly. This local telemetry path cannot synchronously block an Amazon Bedrock request based on a token budget. If hard enforcement is required, use an in-path gateway with budget controls and evaluate the operational and identity-attribution tradeoffs.
Roll out in phases
Start with one engineering group whose leaders and developers agree on the purpose of the telemetry. Validate that identity attribution is accurate, the dashboard answers real operating questions, and access controls reflect your governance policy.
Next, add a small set of controlled organizational dimensions and define alerts for conditions that require action. Expand through managed workstation configuration only after the collector lifecycle, identity updates, and support process are repeatable. Finally, pair CloudWatch usage telemetry with CUR 2.0 reporting so leaders can review adoption and operational behavior alongside billing-grade costs.
This sequence keeps the initial investment small and gives stakeholders an opportunity to refine both the metrics and the decisions they support.
Clean up
To remove the monitoring pattern, stop the collector on developer workstations and delete the dashboard stack:
If no other workload depends on the account-level enrichment features, you can evaluate disabling them with aws cloudwatch stop-otel-enrichment and aws observabilityadmin stop-telemetry-enrichment. Confirm dependencies first. These settings can support other CloudWatch observability use cases in the account.
Conclusion
Scaling Codex is not only an access decision. It is an operating-model decision that connects developer enablement, system reliability, governance, and financial accountability.
By combining Codex OTel metrics, IAM Identity Center attributes, a local collector, and Amazon CloudWatch, organizations can build decision-ready visibility without placing a new centralized service in the inference path. CloudWatch shows how Codex is being used. CUR 2.0 provides the financial source of truth. Together, they support a measured path from pilot to governed adoption.
Use the Codex on AWS native access quickstart to begin a pilot, then adapt the dimensions, access model, and reporting cadence to the decisions your organization needs to make.
This post describes an implementation pattern based on a public guidance repository. It does not imply publication or endorsement by AWS.
About the authors