


Generate dashboards from natural language prompts in Amazon Quick
Building meaningful dashboards demands hours of manual setup, even for experienced BI professionals. Amazon Quick now generates complete multi-sheet dashboards from natural language prompts, taking you from one or more datasets to a production-ready analysis in minutes. Data analysts building recurring operations reports, program managers preparing a leadership review, or engineers exploring a new dataset can […]

Building meaningful dashboards demands hours of manual setup, even for experienced BI professionals. Amazon Quick now generates complete multi-sheet dashboards from natural language prompts, taking you from one or more datasets to a production-ready analysis in minutes. Data analysts building recurring operations reports, program managers preparing a leadership review, or engineers exploring a new dataset can describe what they want, and Amazon Quick produces multiple organized sheets with visuals selected for your data, filter controls for stakeholders to explore by different dimensions, and calculated fields such as year-over-year growth and month-over-month comparisons. Before generating, you review and edit an interactive plan of the proposed structure, keeping you in control of the final output.
In Amazon Quick, Analysis is the authoring surface where you build and arrange visuals, filters, and calculated fields across multiple sheets. When you’re ready to share, you publish the analysis as a dashboard. This new generative AI capability creates the analysis and you refine and publish it as a dashboard with a single click.
In this post, we walk through generating an analysis from a prompt, reviewing the plan, and exploring the completed output.
Prerequisites
You need the following prerequisites:
- An AWS account
- An Amazon Quick Enterprise Edition subscription
How it works
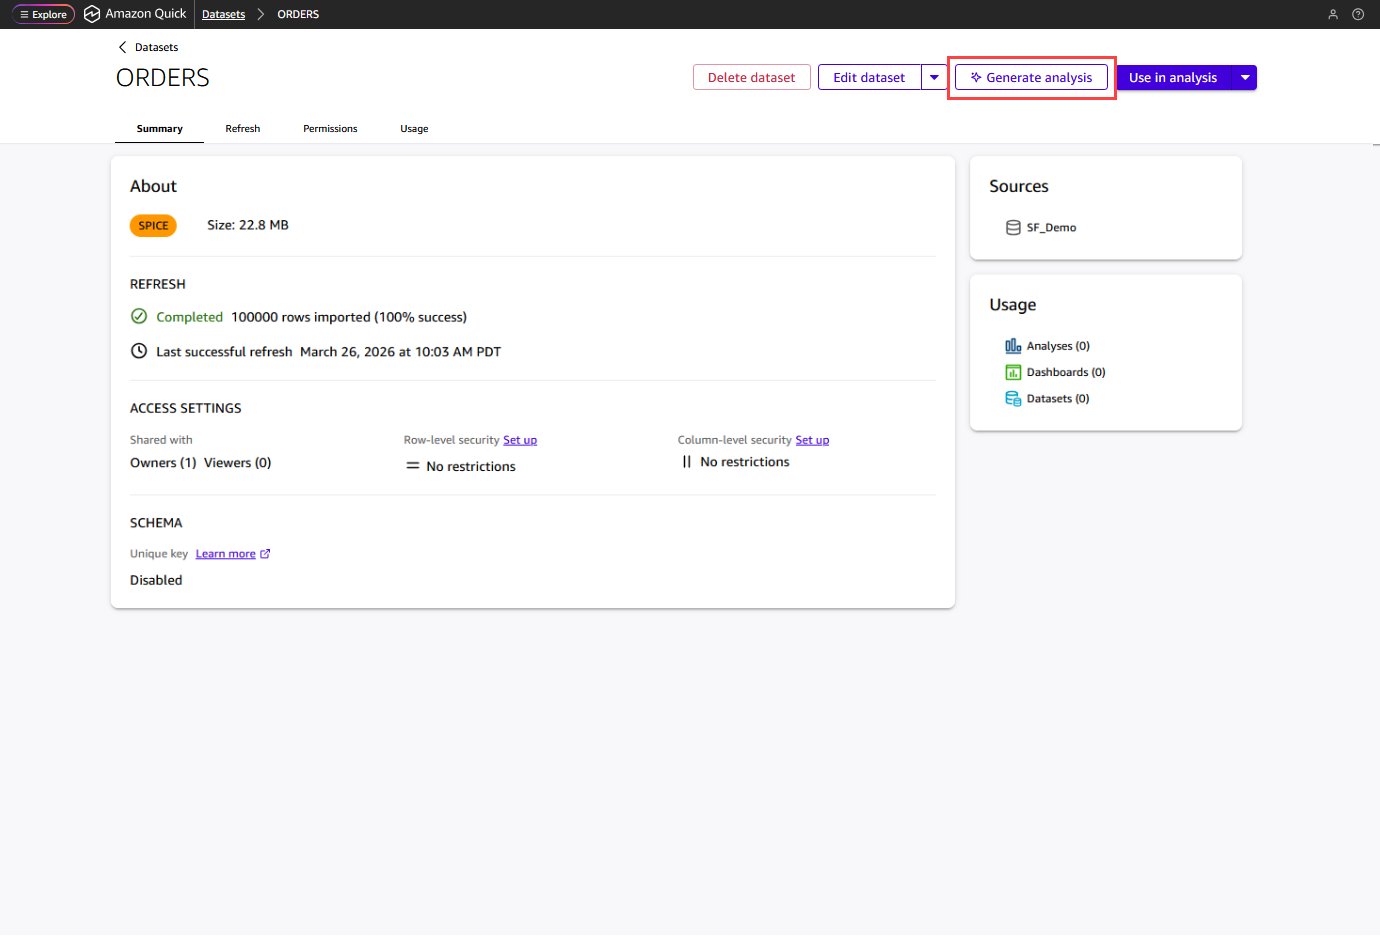
To generate an analysis, start by selecting the data that you want to analyze. In Amazon Quick, your data is stored in datasets, which connect to sources such as Amazon Redshift, Amazon Simple Storage Service (Amazon S3), or uploaded files. With your dataset ready, you describe what you want to see, review a plan, and generate.
Select your datasets
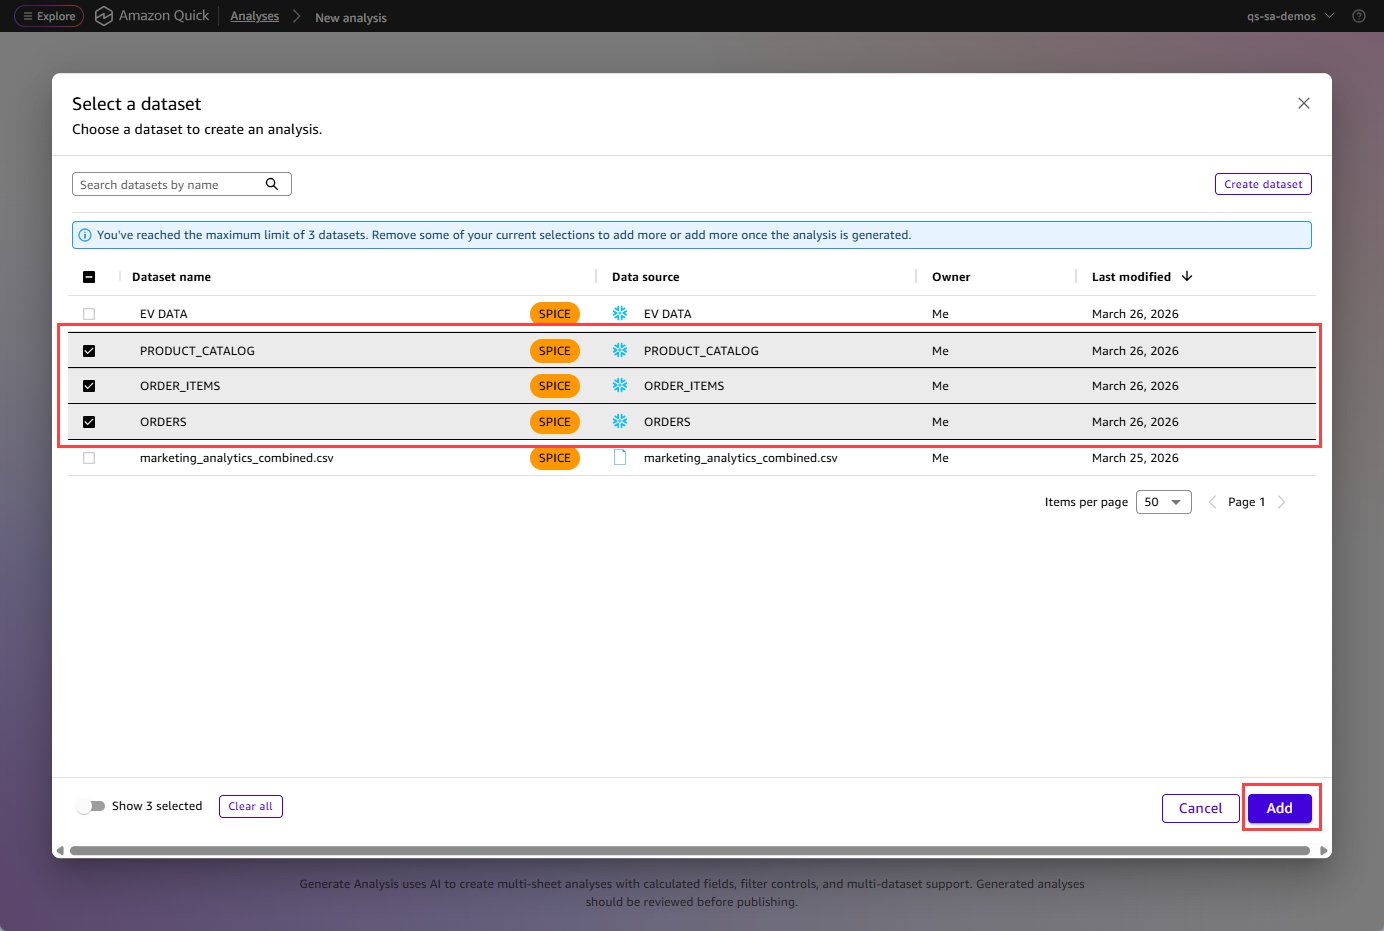
Open a dataset in Amazon Quick and choose Generate analysis. You can also start from the Analyses page. Select 1–3 datasets for the analysis. If your data spans multiple tables—orders in one dataset and products in another—you can select them together.
Choose Add data to add more datasets if required.
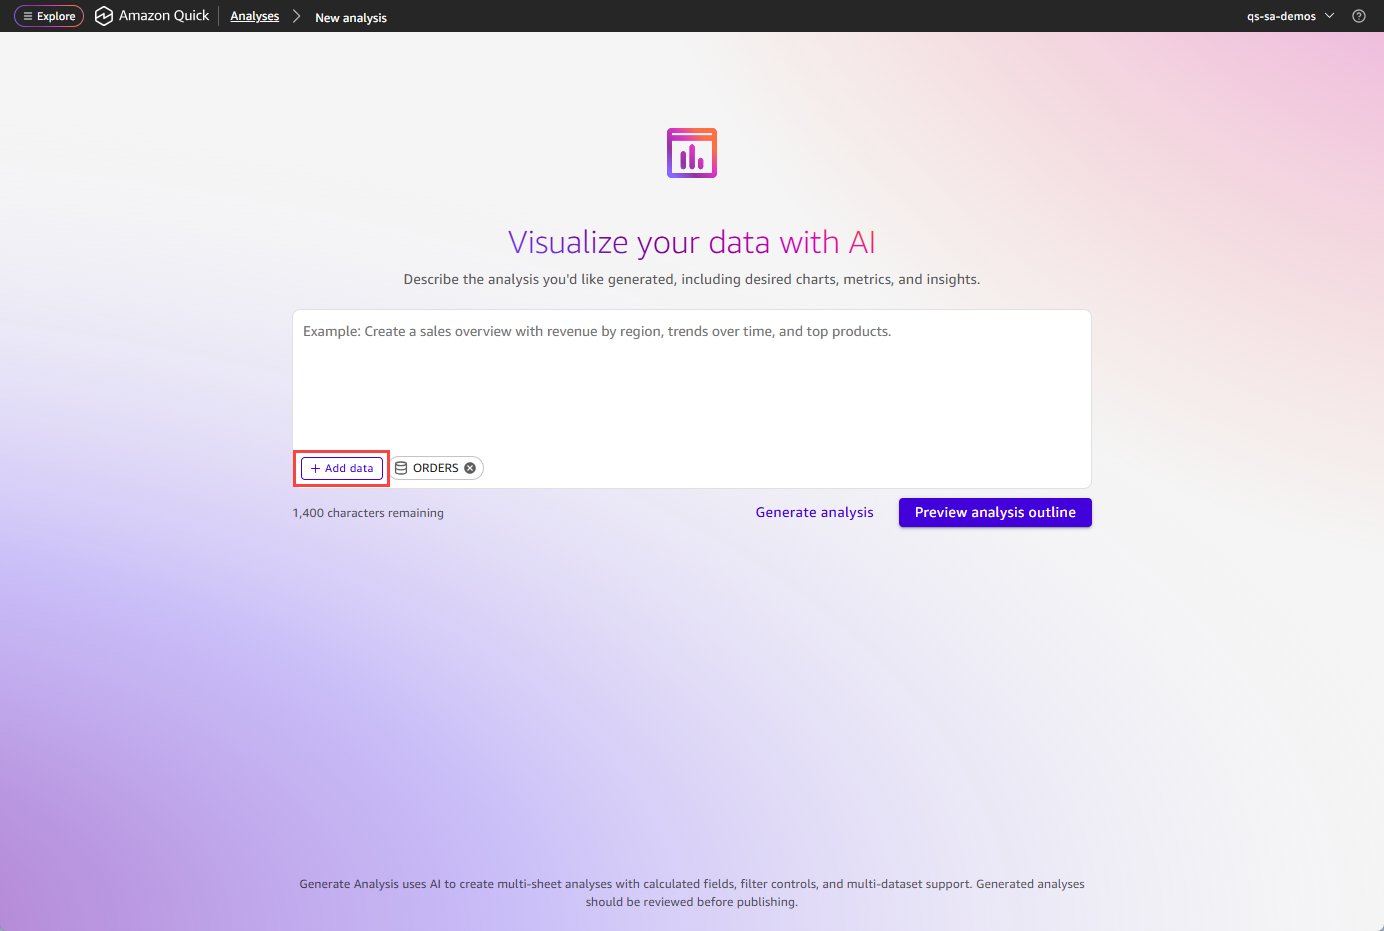
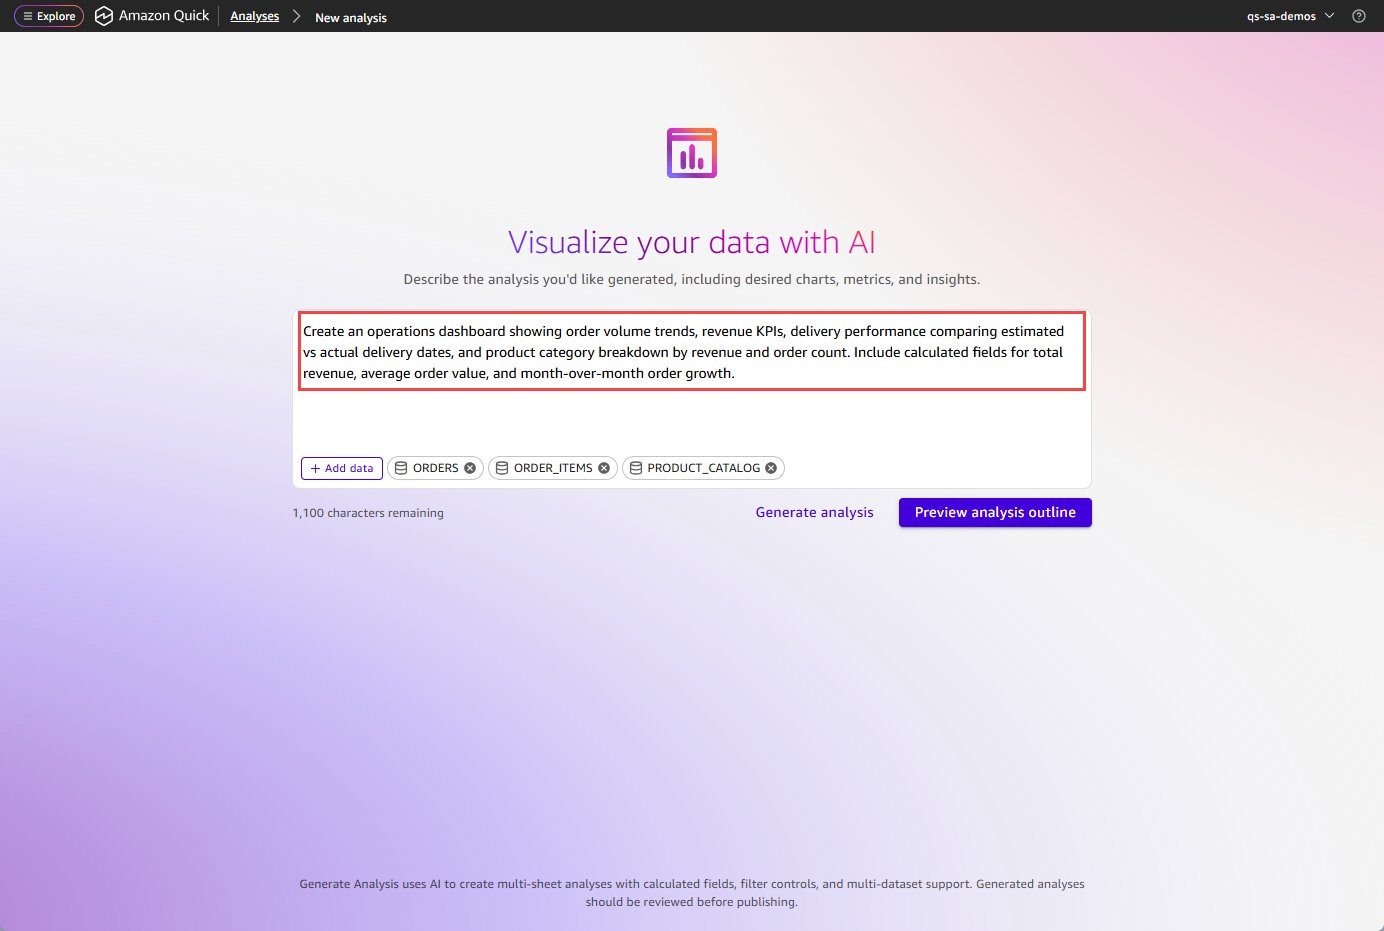
Describe what you want in the analysis / dashboard
Write a natural language prompt describing the insights you want to author in the Analysis. Describe the business questions, the metrics that you care about, and how you want the information organized across sheets. For example: “Create an operations dashboard showing order volume trends, revenue KPIs, delivery performance comparing estimated vs actual delivery dates, and product category breakdown by revenue and order count. Include calculated fields for total revenue, average order value, and month-over-month order growth.”
Amazon Quick analyzes your data
Amazon Quick examines your dataset structure and column statistics. You see real-time progress updates as it works: analyzing dataset columns, analyzing column statistics, creating the analysis plan.
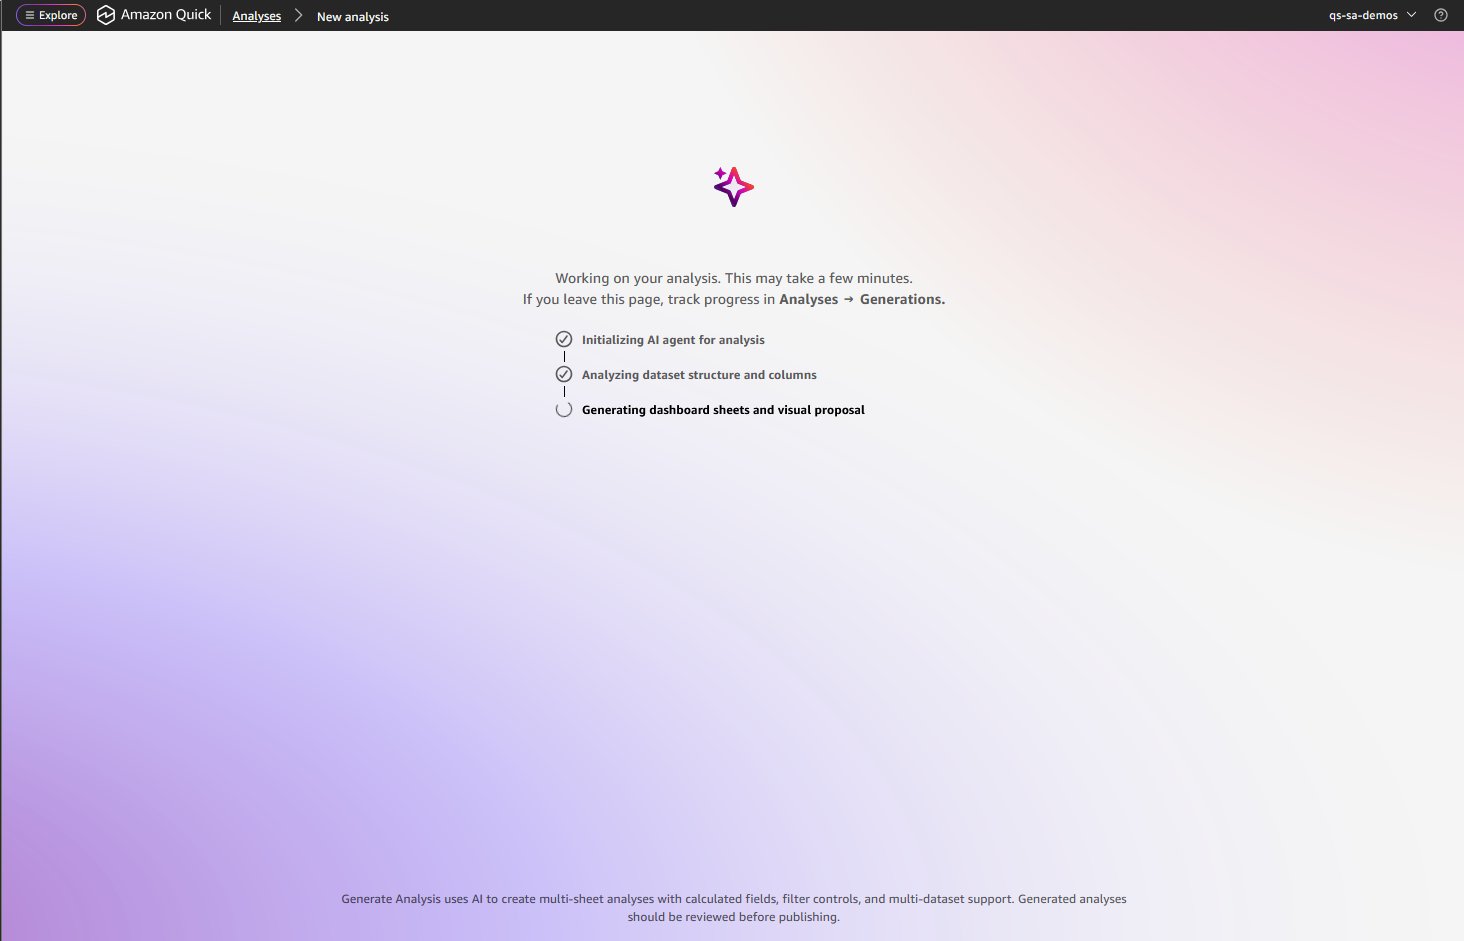
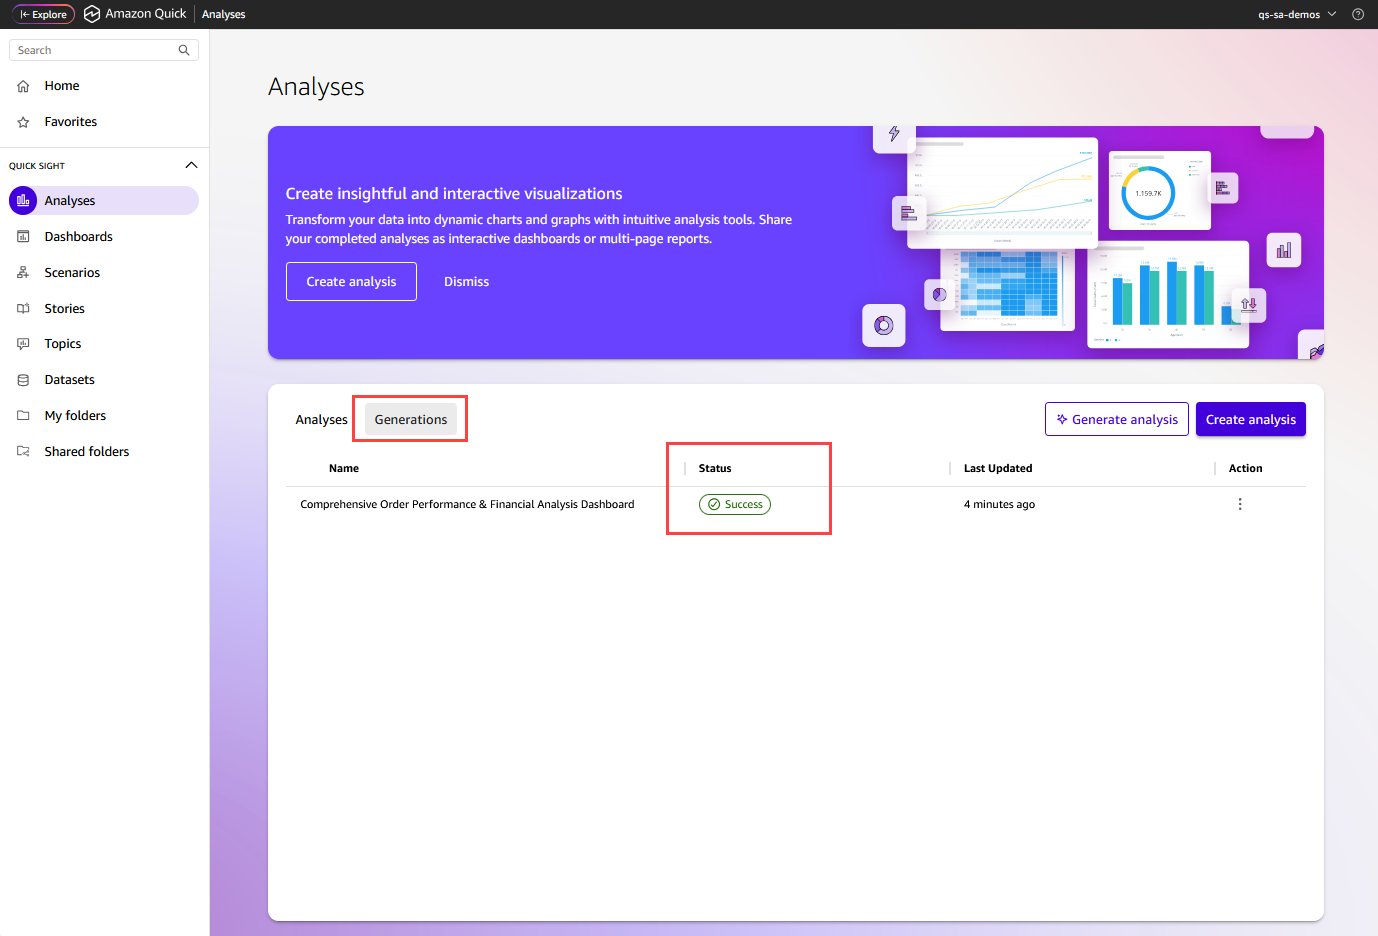
If you navigate away, use the Analyses → Generations tab to check status and return to the progress screen.
Review and edit the plan
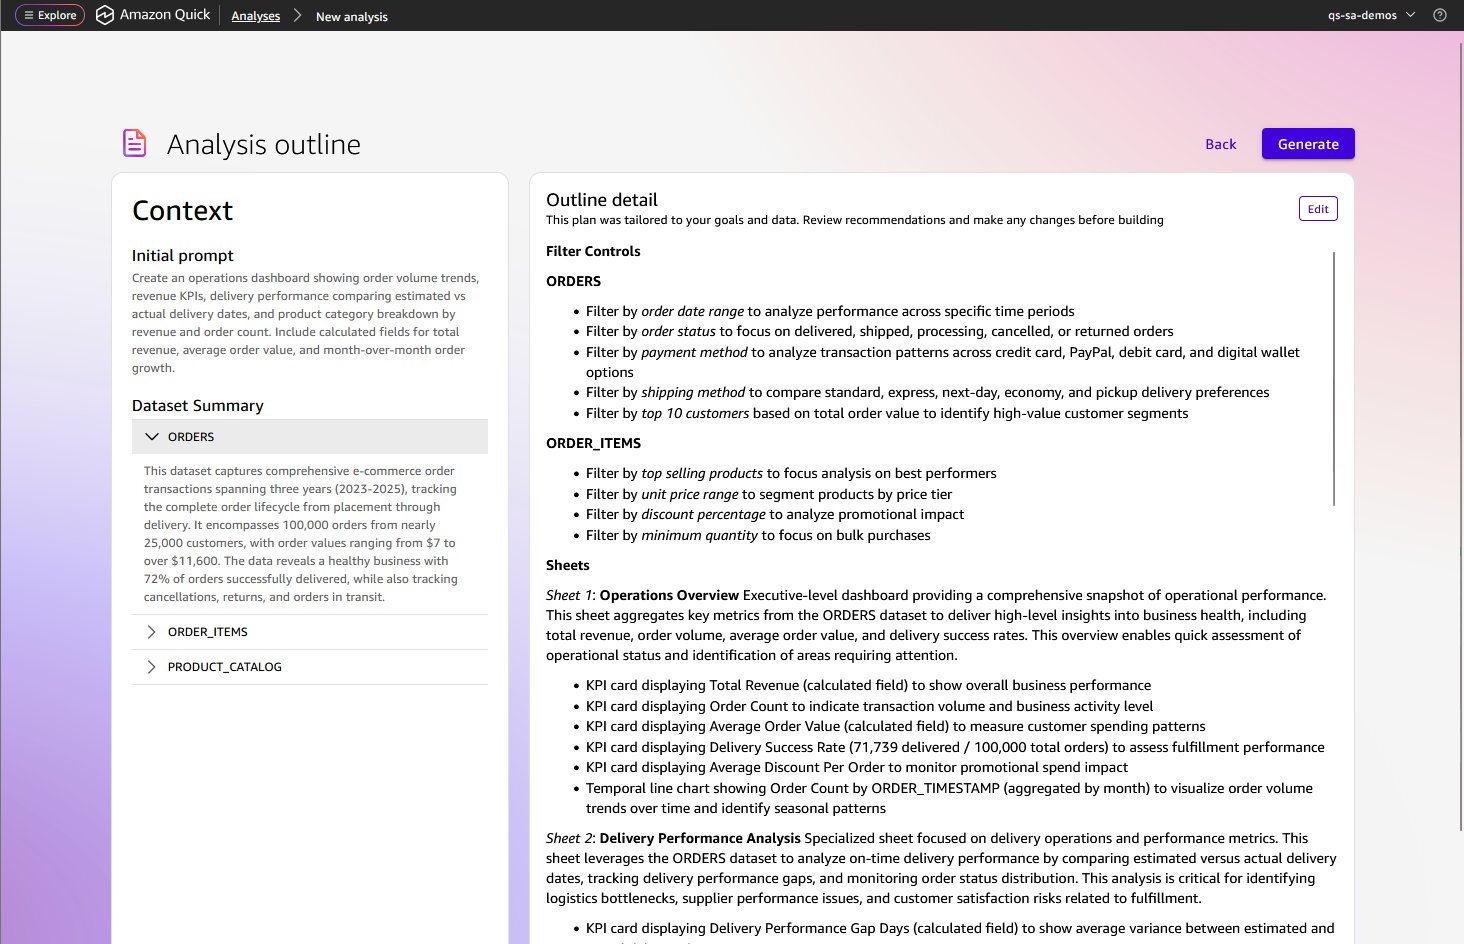
Amazon Quick presents the Analysis outline in a two-pane view. The left pane shows your initial prompt and a summary of the selected datasets. The right pane shows the proposed structure: filter controls, sheets, and the visuals planned for each sheet. You can generate immediately or choose Edit to refine the plan first — adjusting sheet names, adding or removing visuals, or reorganizing the layout.
Generate the analysis
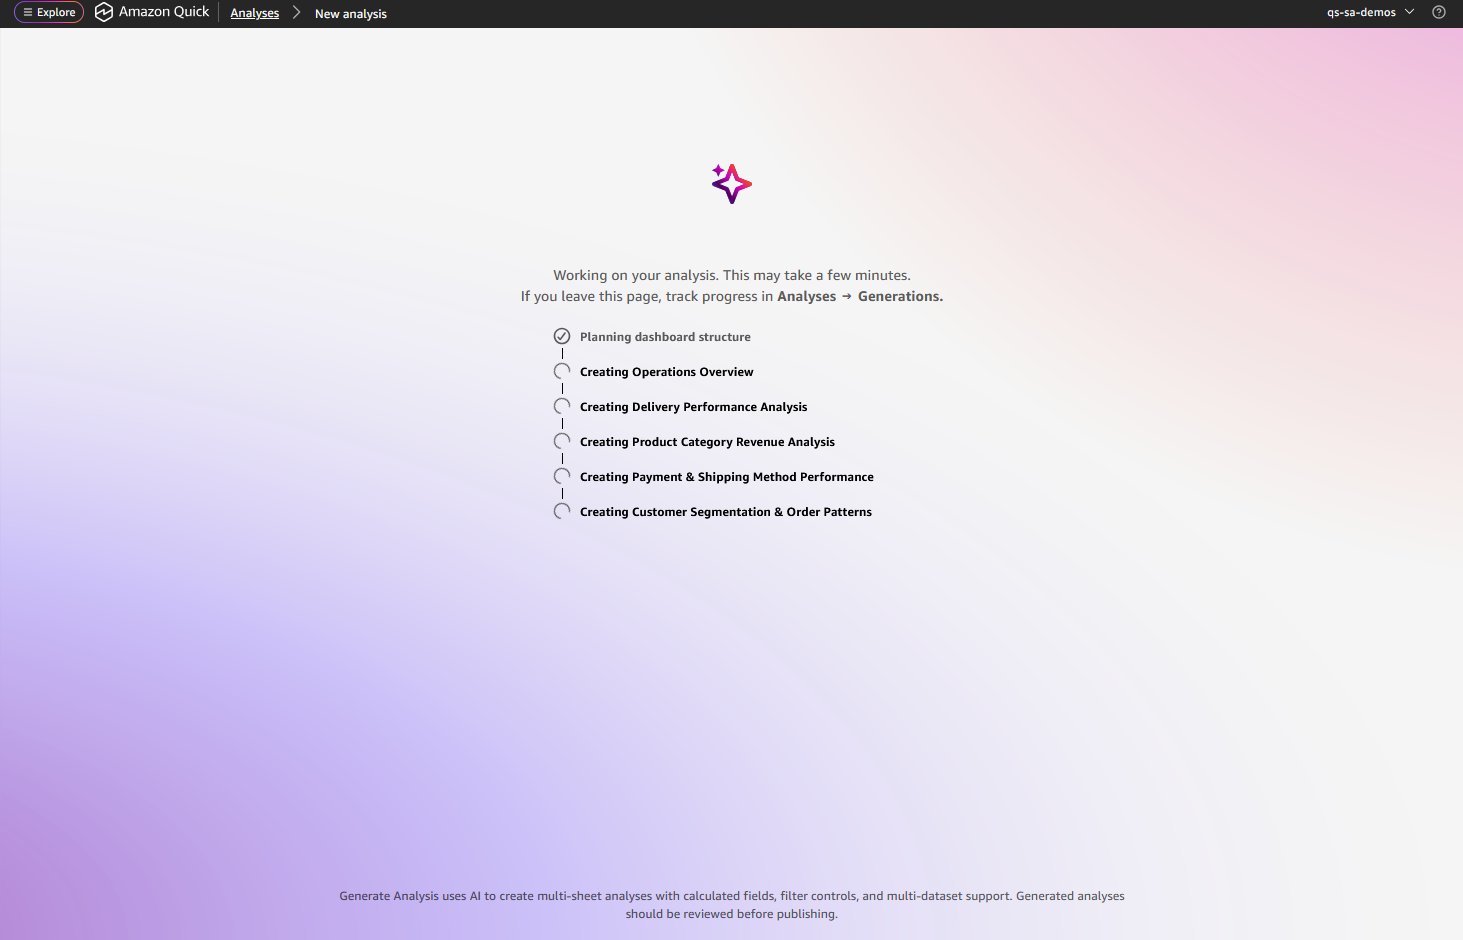
Choose Generate. Real-time progress updates show each component being created: calculated fields, filters, and each sheet sequentially.
Early access authors across operations, engineering, and data science found this capability a significant time saver, turning what previously took hours of manual configuration into minutes of guided generation.
During early access, an author who had never used AI analytics before tested the feature with his first dataset: “The results are awesome and there is no comparison in the time it takes AI to perform analysis and create dashboards vs. a human being.” — Jeff Sondic, Pre-Construction Manager, GES Ops Construction, Amazon, Ontario Canada
The output is a native Quick analysis. It works with existing publishing workflows, embedding patterns, continuous integration and continuous delivery (CI/CD) pipelines, and point-and-click editing in the Analysis surface. You can refine every visual after generation. This isn’t a static image. It’s a live, interactive analysis connected to your data.
Publish and share as a dashboard
When you’re satisfied with the analysis, choose Publish to create a dashboard. You can share the dashboard with other users, embed it in applications within minutes with features like 1-click embedding, or schedule email deliveries. The published dashboard retains all the sheets, visuals, filter controls, and calculated fields from the generated analysis. Recipients interact with the dashboard without access to the underlying analysis.
Getting started
At launch, Generate Analysis is available to Enterprise subscription/Author Pro users. Authors also have promotional access to this capability through December 2026 as part of Amazon Quick Enterprise, provided their organization has not restricted access. Available in the following AWS Regions: US East (N. Virginia), US West (Oregon), Asia Pacific (Sydney), Asia Pacific (Tokyo), Europe (Frankfurt), Europe (Ireland), and Europe (London).
Conclusion
Generate Analysis in Amazon Quick creates complete multi-sheet analyses from natural language prompts, reducing dashboard creation from hours to minutes. During early access, authors across operations, engineering, and data science reported reducing their dashboard creation time by 90% or more.
One author said: “As a new user, creating this dashboard would have taken at least a full day. It took 5 minutes.” — Prabhakant Rasal, SDE-III, PXT DLS Tech, Amazon, Dallas TX
AI builds your starting point. You refine and publish it as a dashboard. Dashboards encode the questions your team needs to answer repeatedly. For the follow-up explorations and one-off questions that arise in between, try Dataset Q&A to query your data directly in natural language.


![KAIZEN Locations & Map Guide – Boss, Chest, Weapon, Style [KASHIMO]](https://www.destructoid.com/wp-content/uploads/2026/02/kaizen-locations-and-map-guide.jpg)