

![[Notice] Advance Notice of Server Transfer Limits](https://clan.akamai.steamstatic.com/images/46074831/d61a3f15dbd37e032968feff620df4c5e501f3c4.png?#)















Transforming professional work: How Amazon Quick turns document creation from hours into minutes
In this post, we explore how the Amazon Quick document and visualization creation capabilities work, what you can build with them, and how professionals across roles are using them to reclaim hours of their workweek. From technical execution to strategic judgment Most professional roles carry an unspoken assumption that a significant portion of your time […]
In this post, we explore how the Amazon Quick document and visualization creation capabilities work, what you can build with them, and how professionals across roles are using them to reclaim hours of their workweek.
From technical execution to strategic judgment
Most professional roles carry an unspoken assumption that a significant portion of your time will go toward mechanical execution. Formatting reports, rebuilding the same spreadsheet templates, and copying analysis findings into slide decks all require attention and precision. They do not require the judgment and domain expertise that make you genuinely valuable.
Quick changes that equation. It pulls live data from Amazon Quick Sight dashboards, Amazon Simple Storage Service (Amazon S3) data lakes, Amazon Redshift warehouses, and Amazon Relational Database Service (Amazon RDS) databases. It then assembles that data into formatted, professional-grade documents ready for stakeholder review.
Quick also draws on Spaces, the Quick organizational knowledge bases. Documents can reflect company-specific context, terminology, and institutional knowledge. The result is not generic output. It is work that sounds like it came from your organization.
Multiple output types
Document and visual creation in Quick currently supports five output types, each with capabilities that go well beyond basic generation. These are data-aware, brand-consistent, fully editable files, not static snapshots.
| Format | File type | Key capabilities |
| Word document | .docx | Structured headings, tables of contents, styled tables, headers, footers, embedded charts and images, multi-section layout. |
| Excel spreadsheet | .xlsx | Working formulas, conditional formatting, multiple worksheets, charts built from actual data, pivot tables, named ranges. |
| PowerPoint presentation | .pptx | Professional themes and layouts, speaker notes, embedded visuals, template cloning from existing branded decks. |
| PDF document | Headers, footers, page numbers, professionally styled pages, formatted tables, print-ready output. | |
| Business visual | .png | Infographics, data visualizations, process diagrams, comparison charts, standalone embeddable images. |
These outputs are fully editable native files. Excel workbooks retain working formulas and conditional formatting, PowerPoint decks preserve slide masters and layouts, and Word documents maintain heading structures and cross-references. You can open them in their desktop applications and continue working without rebuilding.
How it works: the end-to-end workflow
The experience stays entirely within the Quick conversation, no switching between applications, avoiding context loss. The full cycle, from request to downloadable file, happens in five steps:
- Describe. Open a Quick conversation and describe what you need in natural language. Optionally upload source files, CSV, Excel, JSON, Word, PDF, or PowerPoint to ground the output in real data.
- Watch. Quick generates the document with real-time progress updates visible in the conversation.
- Preview. The generated document appears in a dedicated preview panel alongside the conversation.
- Refine. Iterate using two distinct editing paths: Chat-based editing for broad changes, or inline commenting for targeted edits with regeneration.
- Download. Export the finished file in its native format: .docx, .xlsx, .pptx, .pdf, or .png.
Two ways to edit, one streamlined workflow
Chat-based editing
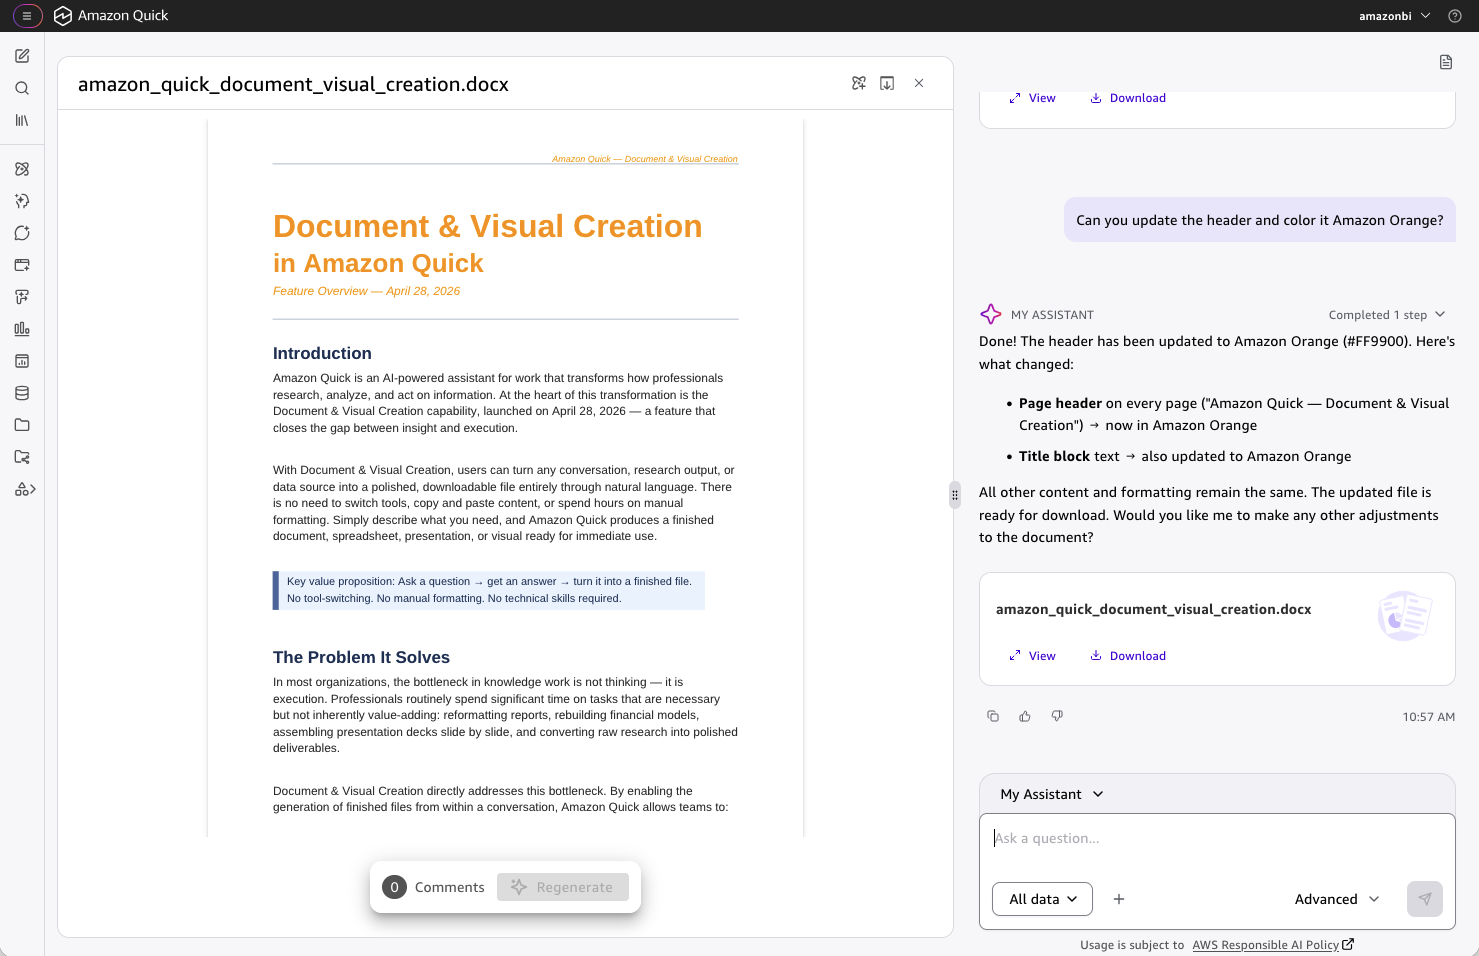
Figure 1: Chat-based editing. Using document and visual creation to edit a document on visual creation. Recursion is not a bug.
This feature is best for broad, document-wide changes.
Type what you want changed in a follow-up message. In Figure 1, the user requests: “Can you update the header and color it Amazon Orange?” Quick interprets the request, identifies the correct hex code (#FF9900), and updates the page header and title block in one step. Other content and formatting stays untouched. Follow-ups can be equally broad or specific: “Add an executive summary at the top,” or “Restructure the financial section with quarterly columns instead of annual.” Each request regenerates only what needs to change.
Inline commenting
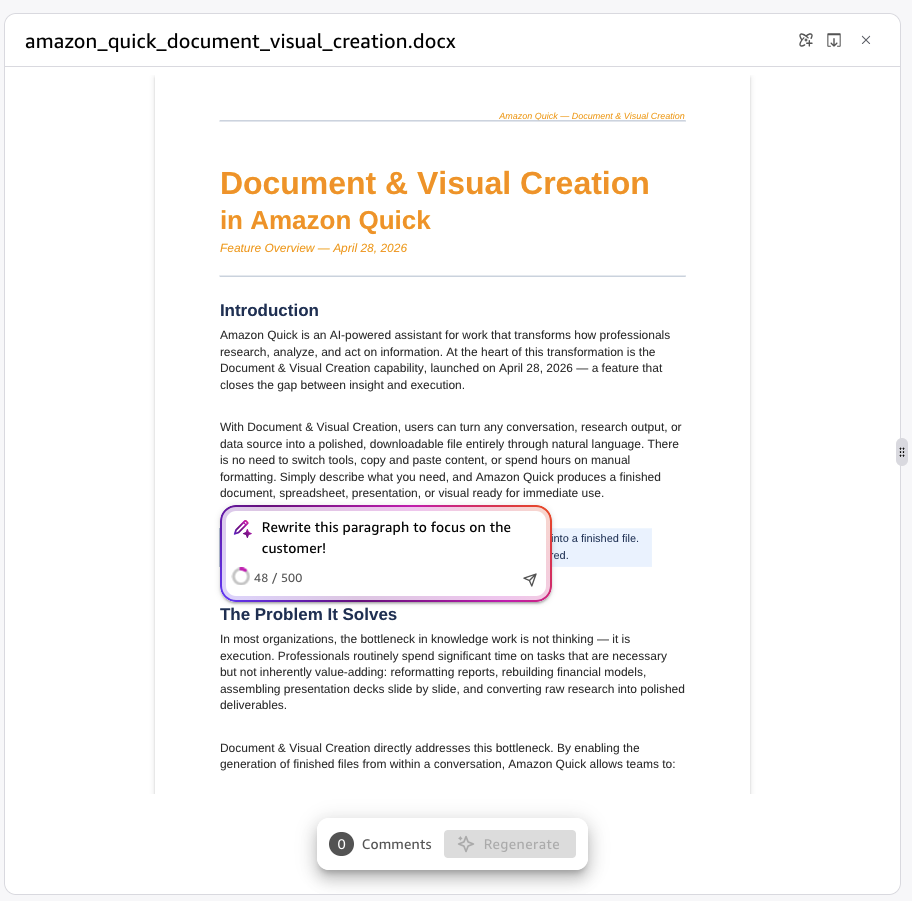
Figure 2: Inline commenting. Highlight any text in the preview, leave a note, and Quick regenerates that section. Surgical precision, zero collateral damage.
This feature is best for targeted, location-specific edits.
In the preceding example, the user clicks in the document preview and highlights a passage that is too vague. A comment box opens where the user types feedback directly on the selection. In this case: “Rewrite the paragraph to focus on the customer!” The user then chooses Regenerate, and Quick rewrites only that highlighted section based on the note. The rest of the document stays unchanged.
Start broad, get specific. Use chat-based editing to establish structure, tone, and layout in early passes. Switch to inline comments to refine specific sections after the document is substantially right. Each iteration preserves what’s working and updates what isn’t.
Template cloning and brand theming
Document and visual creation respects that investment through two mechanisms that distinguish it from generic artificial intelligence (AI) document generation.
PowerPoint template cloning
Upload an existing branded .pptx file as a template, a quarterly business review deck, a customer pitch, or an internal all-hands format. Quick analyzes the slide layouts, theme fonts, brand colors, and structural patterns. When generating new content, it clones the template slides that best match each section, preserving backgrounds, decorative elements, logos, and visual identity.
Excel template cloning
Upload a formatted workbook as a template. Quick clones the workbook structure, preserves formatting and formulas, and populates it with new data. This is ideal for recurring reports where the layout stays constant but the numbers change every period, such as monthly financial summaries, weekly key performance indicator (KPI) trackers, and quarterly performance dashboards.
Brand theming across supported output types
Upload a theme configuration with your brand colors and SVG logos, and Quick applies them automatically across Word documents, Excel spreadsheets, presentations, PDFs, and infographics. Documents generated from Quick conversations can match your organization’s visual standards, without manual formatting work.
These capabilities make document and visual creation enterprise-ready, not just individually useful. A single analyst producing consistent, on-brand deliverables at the speed of conversation changes what a small team can accomplish.
Data-aware generation: where accuracy matters most
The most common complaint about AI-generated documents is fabricated data. Quick solves this differently. Source data can be uploaded directly as CSV, Excel, or JSON, or drawn from connected data sources like Quick Sight dashboards, Amazon Redshift clusters, or Amazon RDS databases. Quick uses that data exactly as given. No fabrication, no invented data points. The financial model reflects the numbers in your dataset. The dashboard chart reflects your actual metrics. The compliance report pulls the figures from your uploaded source.
This is the foundation of professional-grade output. The mechanical execution, formatting, structure, and layout are handled automatically. The accuracy of the content is grounded in the data you provide. The judgment about what those numbers mean remains yours.
Examples of real-world impact
The abstract case for productivity transformation is straightforward. Here’s what it looks like in practice.
Sales leadership: quarterly pipeline forecast
A sales leader needed a quarterly pipeline forecast workbook for a regional business review. This kind of document typically consumes a full workday. It requires pulling data from the customer relationship management (CRM) system, cleaning it for the spreadsheet, building pivot tables, formatting charts, and cross-referencing regional targets.
With Quick, the same output took 45 minutes, producing a multi-sheet workbook with live CRM data, conditional formatting that highlighted at-risk deals, and auto-updating charts for each region. The remaining time went to the analysis itself, evaluating which deals warranted senior attention before the review, rather than building the infrastructure to surface them.
The workbook was editable and formula-driven. When pipeline projections shifted two days before the review, updates propagated automatically. No rebuilding, no reformatting.
Finance team: ROI modeling across adoption scenarios
A finance team needed to model return on investment (ROI) across multiple software adoption scenarios. The workbook required sensitivity tables, net present value (NPV) calculations, and scenario analysis at different adoption rates. Building that model from scratch requires both financial modeling expertise and significant time investment in formula construction and validation.
Quick generated the initial model by pulling historical cost data from a connected Amazon Redshift data warehouse and validating initial assumptions against Amazon RDS-stored spending patterns. The model included working NPV and internal rate of return (IRR) calculations, a sensitivity table showing outcomes at five adoption levels, and scenario comparison charts.
The team’s time shifted from formula debugging and formatting to assumption testing, the part of financial modeling that requires their expertise. They found two scenarios in the sensitivity analysis that would have been difficult to identify in a manual build. First, a breakeven point that appeared earlier than expected under conservative adoption assumptions. Second, an ROI cliff at higher adoption rates tied to integration costs that hadn’t been fully modeled.
Applications across roles
The following examples illustrate the range of practical applications.
| Role | Example applications |
| Sales | Pipeline forecast workbooks with live CRM data and weighted deal calculations. Branded client-facing proposals with pricing tables and competitive positioning. Quarterly business review decks built from performance dashboards. Win/loss analysis reports with trend charts and deal-stage breakdowns. |
| Finance | ROI and NPV models with sensitivity tables across multiple scenarios. Budget variance reports pulling actuals from connected data warehouses. Board-ready financial summaries with charts, footnotes, and period-over-period comparisons. Audit-preparation workbooks with structured data trails and reconciliation tables. |
| Marketing | Campaign performance reports with channel-level ROI breakdowns. Branded content briefs and creative strategy decks. Competitive landscape analyses with positioning charts and matrices. Event recap presentations with registration data, engagement metrics, and follow-up recommendations. |
| Operations | Production dashboards tracking throughput, defect rates, and capacity utilization. Supply chain analysis reports highlighting bottlenecks and lead times. Process documentation with workflow diagrams and standard operating procedures. Vendor scorecards comparing cost, quality, and delivery performance. |
| Legal | Contract summary workbooks extracting key terms, obligations, and renewal dates from uploaded documents. Regulatory compliance reports with structured finding tables and remediation tracking. Policy briefs with executive summaries, risk assessments, and recommendation matrices. Matter status reports consolidating case data across multiple workstreams. |
What this means for your organization
The individual productivity gains are real and measurable, but the organizational implications are broader.
When document production is no longer a bottleneck, smaller teams can maintain the output quality and volume that previously required larger ones. When brand-consistent, data-accurate deliverables are available to knowledge workers broadly, not only to those with design skills or deep technical expertise, the quality floor across the organization rises.
The capability is available now and connected to AWS data sources your organization likely already uses. You don’t need additional configuration to start using Quick Sight dashboards, Amazon S3 data lakes, Amazon Redshift warehouses, or Amazon RDS databases as document sources. The infrastructure is already there. What changes is what you can do with it.
Perhaps most importantly, the iterative workflow means the learning curve is conversational. You don’t need to know how to use a new application. You need to know how to describe what you want. That’s a skill most knowledge workers already have.
Best practices for new users
Be specific about content, structure, and formatting requirements when describing what you need. The more context you provide, the closer the first draft lands to your intended result. Upload source data such as CSV, Excel, or JSON files when you want documents built from real numbers rather than generated placeholders. For presentations and spreadsheets that need to match organizational standards, upload your existing branded deck or workbook as a template. Finally, treat the process as iterative: start with a first draft and refine using follow-up messages or inline comments. The output improves quickly with each pass.
Conclusion
In this post, we explored how the document and visual creation capabilities in Amazon Quick turn time-consuming production work into conversational drafts you can refine and download in minutes. We looked at how chat-based editing and inline commenting work together, how template cloning preserves brand standards, how Quick grounds output in your connected data sources, and how teams across sales, finance, marketing, operations, and legal apply these capabilities.
The shift from document producer to strategic thinker doesn’t happen all at once. It happens conversation by conversation, as the mechanical work moves to Quick and the judgment work stays with you.
That shift is about to go further. Right now, Quick meets you in a conversation window. The next installment in this series explores what happens when the intelligence described in the preceding sections breaks out of a single application entirely. It embeds itself directly inside the productivity tools where knowledge workers already spend their day. Rather than coming to Quick, Quick comes to you. Stay tuned.
Document and visual creation is available in all AWS Regions where Amazon Quick is generally available. To get started, try Quick for free for 30 days. For more information, visit the Amazon Quick detail page and the Amazon Quick documentation.
About the author