


Introducing Dataset Q&A: Expanding natural language querying for structured datasets in Amazon Quick
In this post, you learn how to get started with Dataset Q&A, explore real-world use cases with hands-on examples, and discover advanced capabilities like auto-discovery across all your data assets and multi-dataset querying in a single conversation.
Every BI team knows this bottleneck: a business user has a question that falls outside existing dashboards, so they file a ticket. An analyst writes the query, validates the results, and delivers them—hours or days later. Multiply that by hundreds of ad-hoc requests per month, and the backlog becomes the single biggest constraint on data team productivity.
Amazon Quick now adds a powerful new natural language query capability, Dataset Q&A, to remove this bottleneck. Your question is translated into SQL, run against the full dataset, and the results are returned in seconds—no row sampling, topic curation, or pre-configured calculated fields required.
Quick already offers two natural language querying modes. Dashboard Q&A is intended for questions about data visualized in published dashboards, drawing on the business context that authors have built into each view. Topic Q&A goes further. Authors enrich the data model with business-friendly field names and synonyms, so users can query a curated set of fields in plain language. Dataset Q&A now completes the picture. Users can explore any dataset directly, going beyond what an author has pre-configured, while all the security, permissions, and governance that enterprises expect from Quick remain fully enforced.
While the industry has raced to ship text-to-SQL demos, the real challenge in enterprise BI has never been generating SQL. The challenge is grounding ambiguous business language against complex schemas, enforcing security at every step, and explaining what the system did and why. The agentic system of Quick is purpose-built for this. The model must resolve lexical ambiguity—does “volume” mean row count, revenue, or units shipped?—and map colloquial business language to the precise column names and calculations in the dataset, without a predefined dictionary. Before any query runs, the system searches across all your structured assets (dashboards, datasets, and topics) using a semantic graph that understands how your assets relate to each other. This lets it find the right source even when your question doesn’t use the exact name of a dataset or column. After the source is identified, the system peeks into the data for context like sample values and distributions and uses author-provided field descriptions and business context to disambiguate before using one of the three capabilities available for generating SQL.
This launch also introduces Dataset Enrichment, a streamlined way for authors to ground the system in business context for a single dataset with no topic configuration required. If the business context already exists outside of Quick (in a data catalog, a modeling tool, or a team wiki), authors can upload it directly as a file against the dataset. Field descriptions, intended relationships across fields, custom instructions about specific columns or the dataset as a whole, all of it can be provided in industry-standard formats (YAML, JSON) or as plain-text instructions. The system applies this context automatically to every query, so an author defines it once and every user benefits at scale.
Trust requires transparency. With this launch, we also introduce Chat Explainability. For any intermediate step involved in answering a natural language query, the system now gives users mechanisms to explore what happened under the hood. When structured data capabilities are invoked, users see step-by-step reasoning behind each answer—the generated SQL, the assumptions the agent made, filters it applied, and a plain-language explanation for non-technical stakeholders. There is no black box.
In this post, you learn how to get started with Dataset Q&A, explore real-world use cases with hands-on examples, and discover advanced capabilities like auto-discovery across all your data assets and multi-dataset querying in a single conversation.
Solution overview
Dataset Q&A lets any user ask a question in plain natural language, and the system generates SQL, executes it against the full dataset, and returns an answer in seconds. Results are aggregated by design, and every query automatically respects the row-level security (RLS) and column-level security (CLS) you have already configured — no additional setup required.
Key benefits include:
- Analyze millions of rows – Query the complete dataset without row sampling or data caps.
- Query beyond dashboard – Ask about fields and dimensions that aren’t in any existing dashboard.
- Start querying immediately – No setup overhead required. Begin exploring your data without creating topics or dashboards.
- Explore multi-part questions – Combine filters, calculations, and aggregations in a single natural language query.
- Inspect the generated SQL – Verify query logic, validate accuracy, or learn how the system interpreted your question.
- Understand how questions are interpreted – Review step-by-step reasoning behind each answer, including the assumptions made and filters applied, before sharing results with stakeholders.
Walkthrough
In the following walkthrough, we demonstrate Dataset Q&A using a real-world dataset of bicycle rental trips from a city bike-sharing network. To follow along and replicate the steps in your own environment, make sure that you have the following in place:
- An AWS account. For setup instructions, see Getting Started with AWS.
- Amazon Quick Enterprise Edition enabled in your account with at least one Enterprise user and Professional user. For details, see Amazon Quick Sight editions and pricing.
- Familiarity with Amazon Quick Sight concepts such as datasets and the chat interface. See the Amazon Quick Sight documentation to get started.
For a sample dataset, this walkthrough uses the publicly available last four months of the 2025 Divvy bike trip dataset, which contains bike-sharing trip records from Chicago. Download the files and create a Quick Sight dataset. You can use the append option to combine multiple files. For more details, see the new data preparation experience in the Quick Sight documentation or this YouTube video.
Note: Because the underlying model might phrase or format responses differently across sessions, the exact wording and visual layout of answers may vary from what is shown here. However, the data values and query results should be consistent when using the same question and dataset.
Step 1: Connect to your data
To use Dataset Q&A in the chat experience, complete the following steps:
- In Amazon Quick, choose the Open chat icon in the top-right navigation.
- My Assistant appears as the default system chat agent.
- Access the knowledge picker from the chat footer and choose Add within Specific data and apps.
- In Add Quick assets, choose Datasets and select the Divvy_Bike_Trips dataset.
- Choose Save.
- With the Divvy_Bike_Trips dataset selected, enter questions in the chat interface.
- To begin, try a dataset discovery question: Can you describe the structure of this dataset?
The Quick chat responds with a detailed breakdown of the dataset structure, explaining what information is captured in each column, describes the available fields and their purpose.
Dataset Q&A capabilities can be invoked for both SPICE and direct query datasets including Amazon Redshift, Amazon Athena, Amazon Aurora PostgreSQL and Amazon Simple Storage Service (S3) Tables.
Step 2: Explore the dataset
After connecting to the Divvy_Bike_Trips dataset, you can explore the data through a series of natural language questions. The following examples show how Dataset Q&A handles increasing complexity while maintaining conversational context.
Example 1: Analyze trip patterns
Start with a general exploration of trip patterns across months:
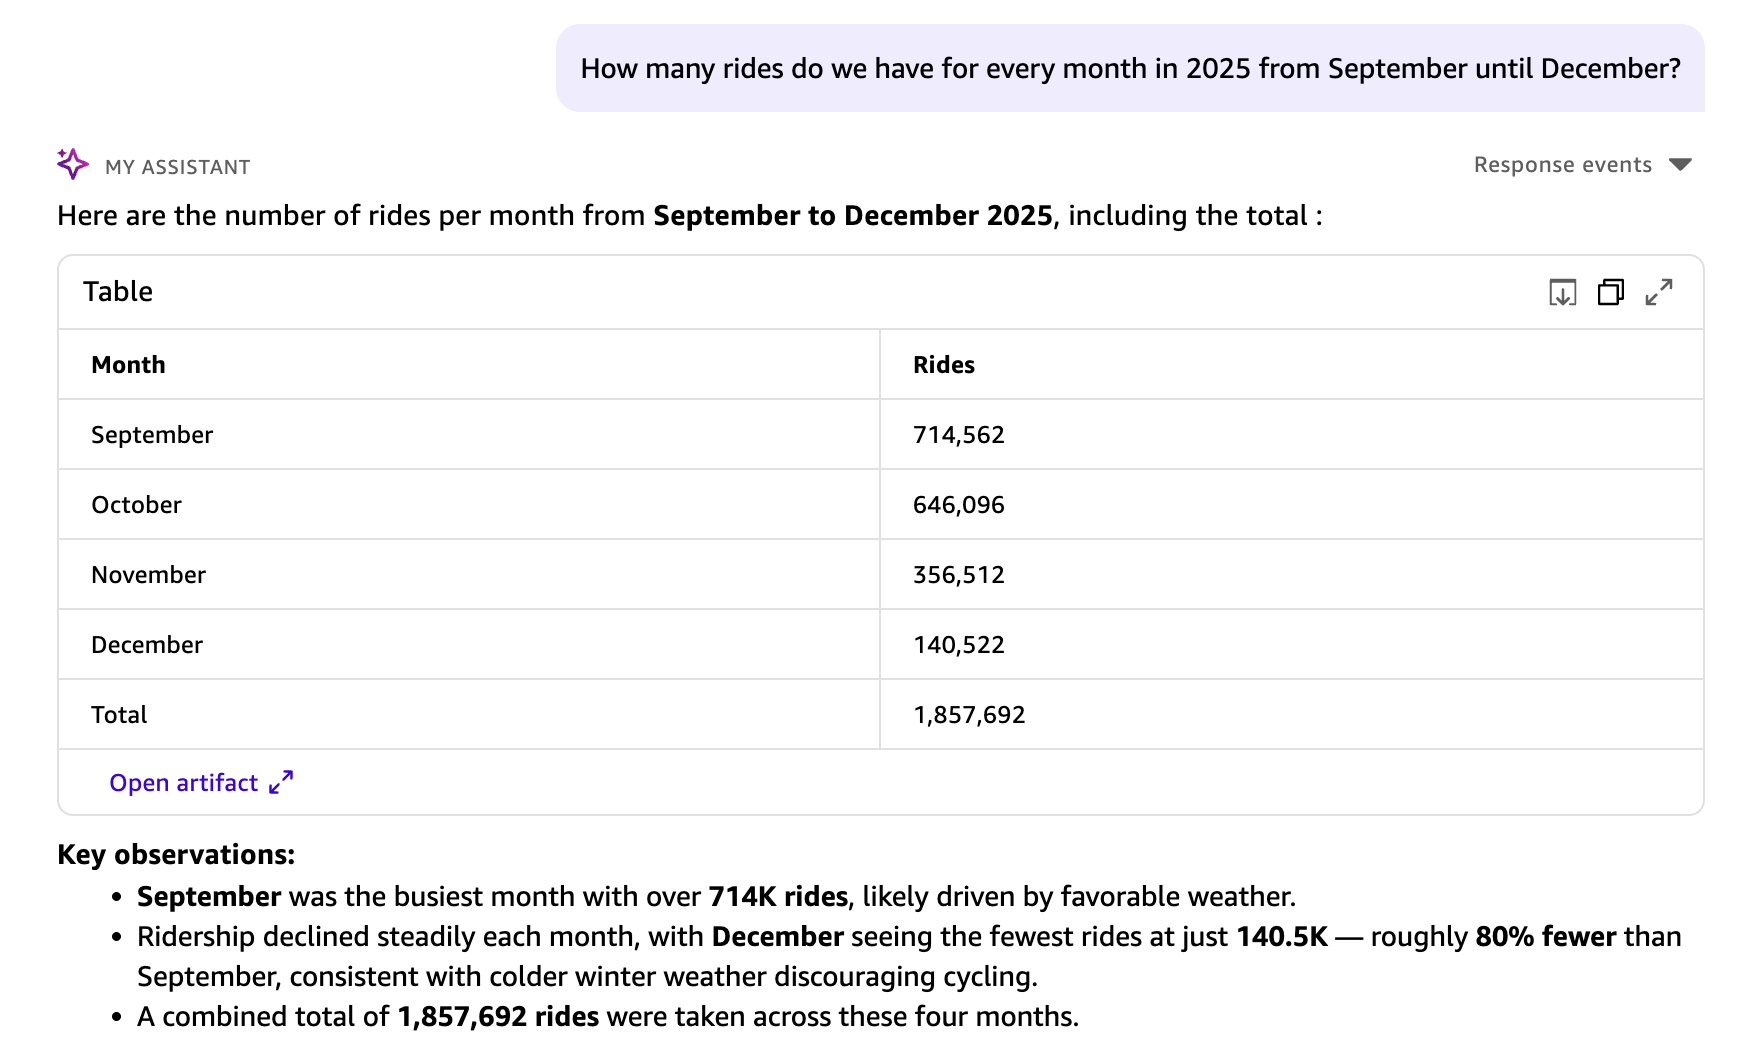
Your question is translated into a structured SQL query. Results appear in a table visual, including a key observations section and suggested next steps. This query analyzed all 1,857,960 rides in the dataset. Dataset Q&A has no row limits for direct query datasets, so aggregations reflect the complete dataset. For SPICE datasets, the aggregations are subject to SPICE capacity.
Example 2: Provide context to guide the model
The dataset contains two timestamp fields: started_at (when the ride began) and ended_at (when the ride concluded). When no context is provided, Quick Chat uses started_at as the logical default for grouping trips by month. To analyze by end time instead, add context to your question:
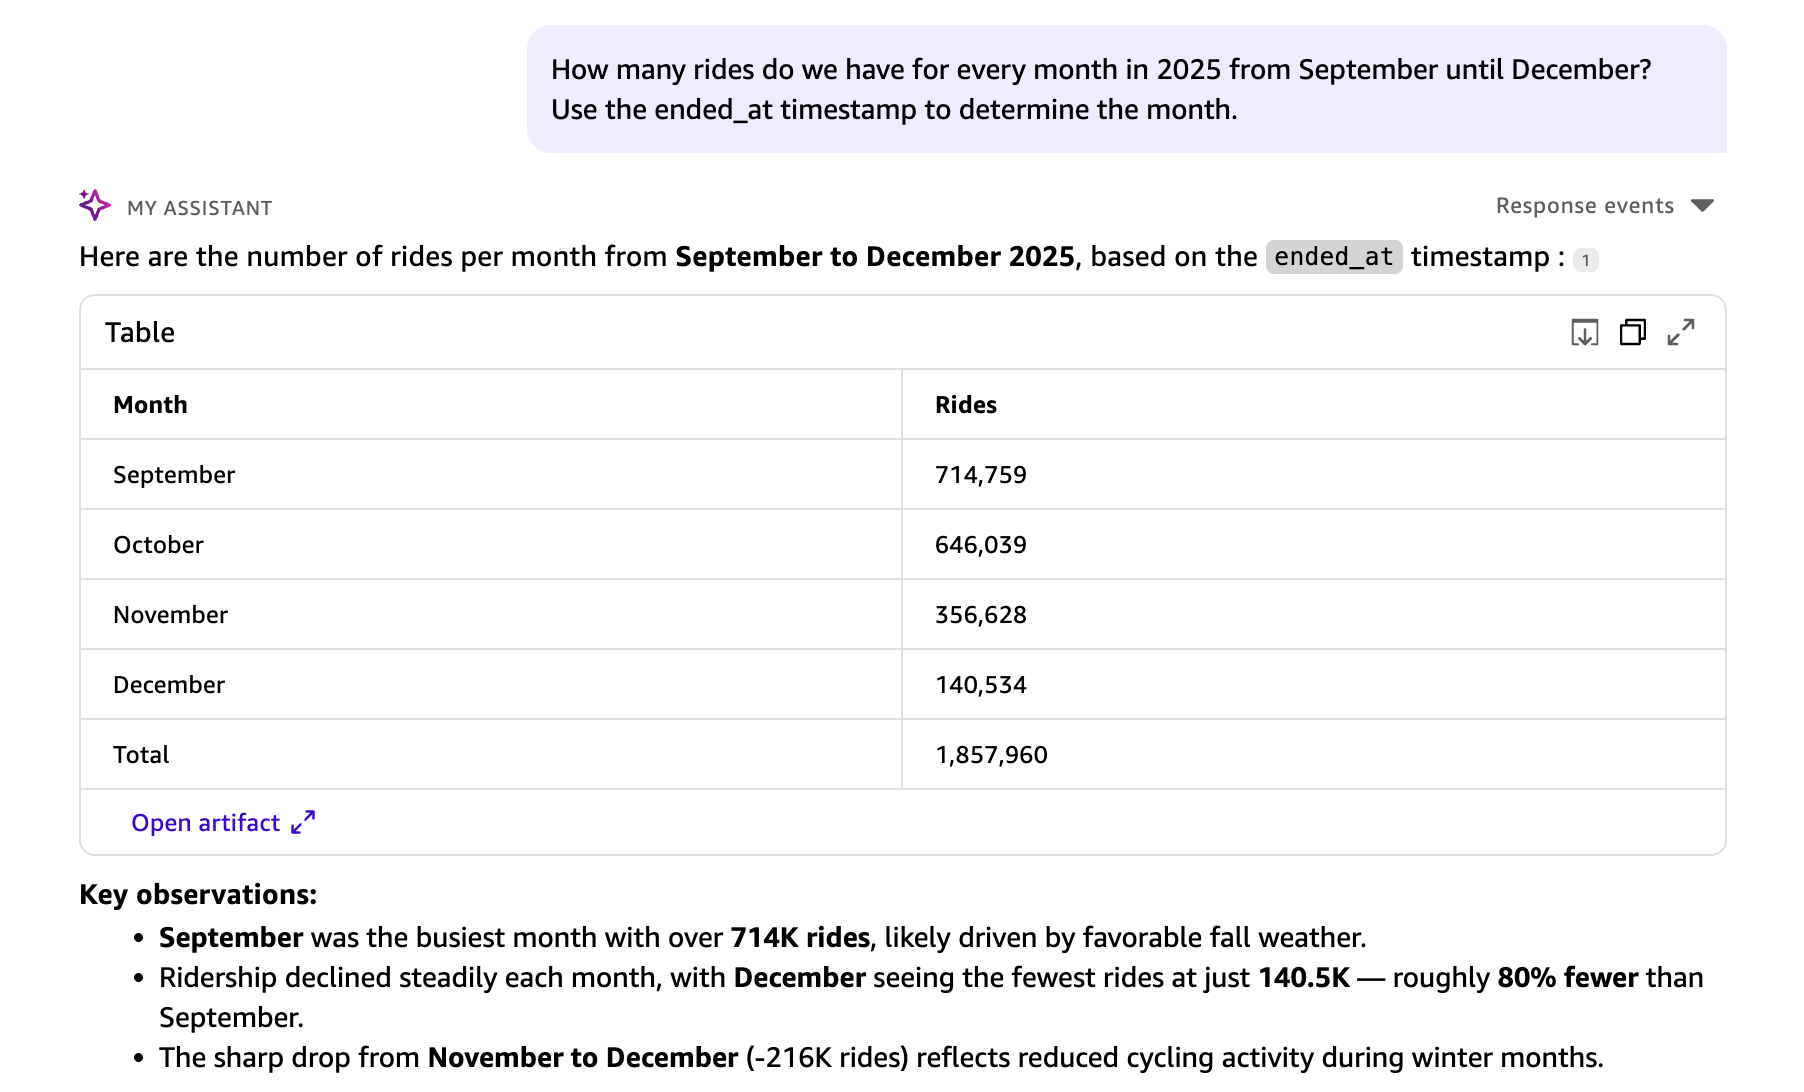
The Quick Chat understands the context and ended_at is used for the month grouping in the response.
Example 3: Inspect the generated SQL
To inspect the SQL that Quick Sight generates, use the Explainability feature available in the chat response. This displays step-by-step reasoning behind each answer, including the generated SQL, so you can verify how the system interpreted your question.
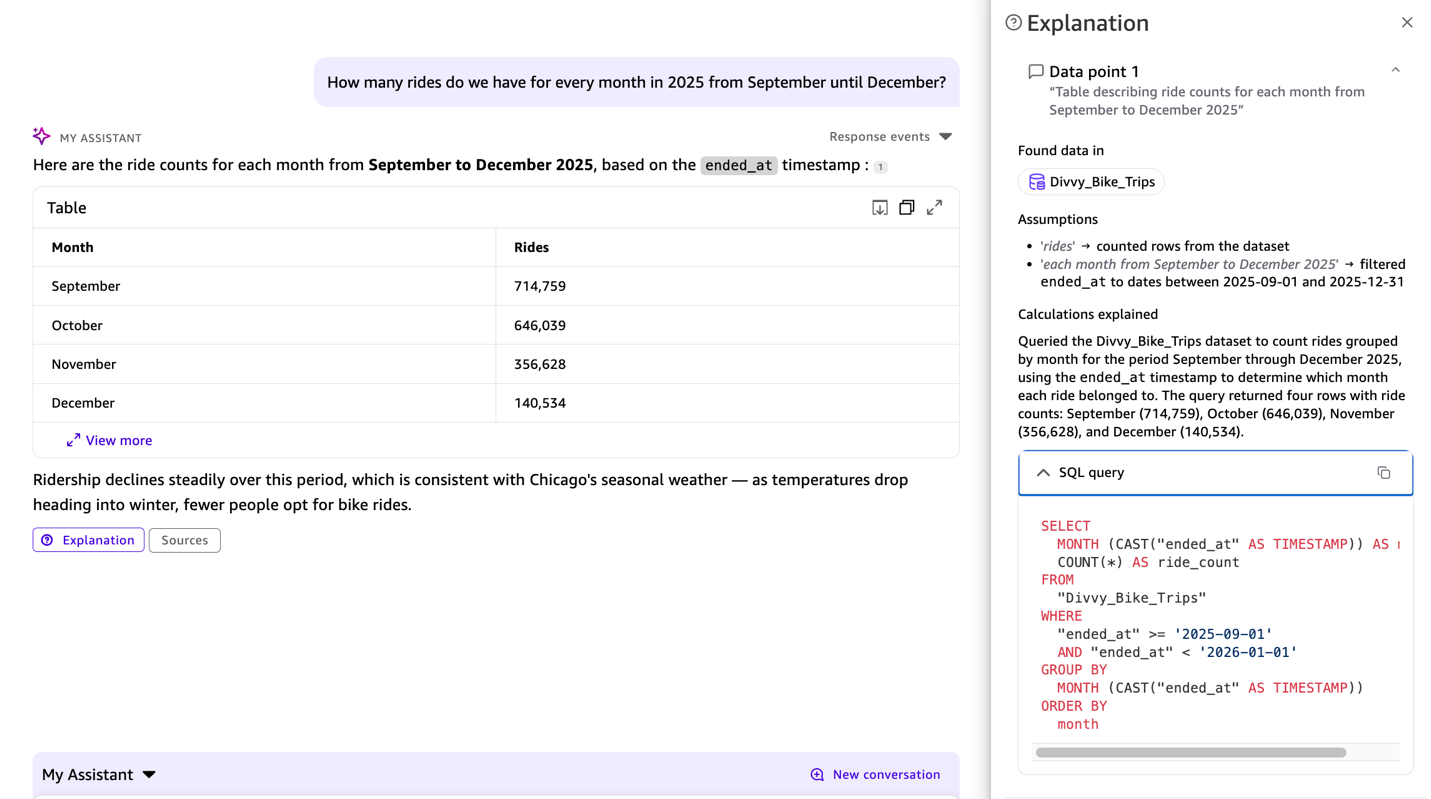
The SQL query appears in the response, showing ended_at used from the previous context, so you can verify that the interpretation is correct.
Example 4: Ask multiple questions at once
You can explore the data with multiple questions in a single prompt:
How many trips by bike type?
How many trips by members?
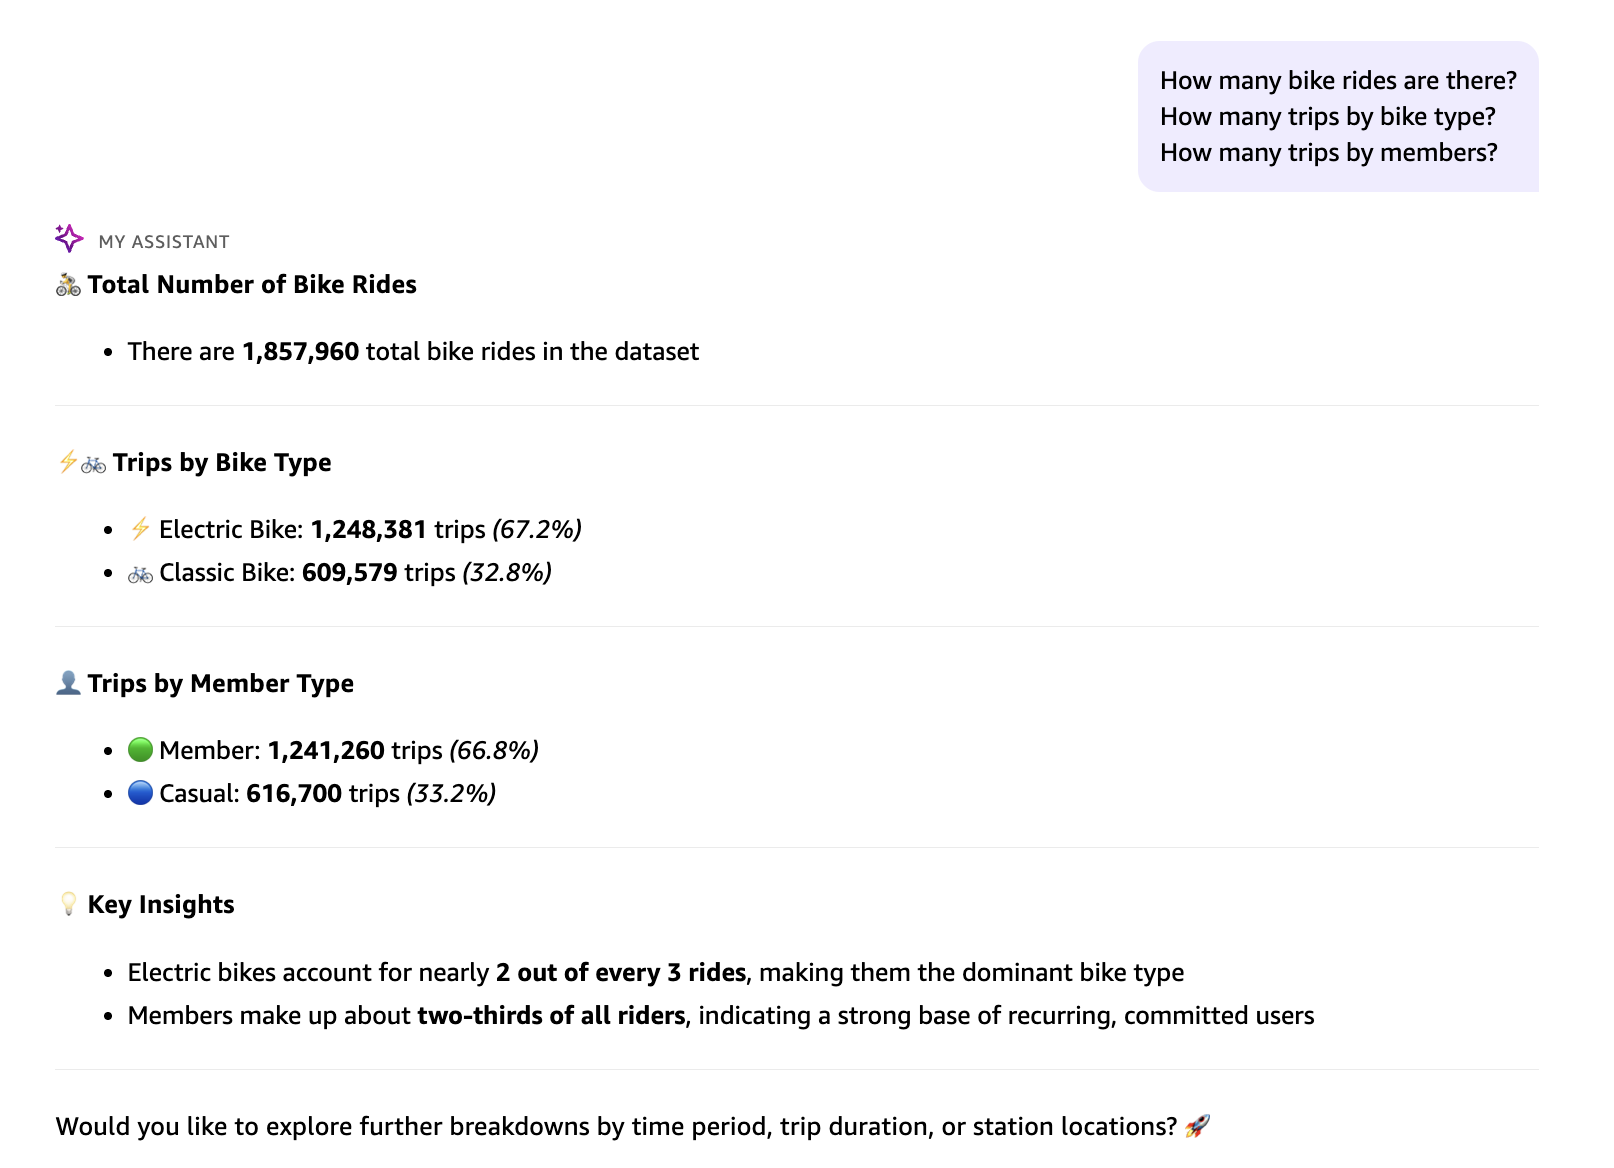
Example 5: Combine advanced calculations
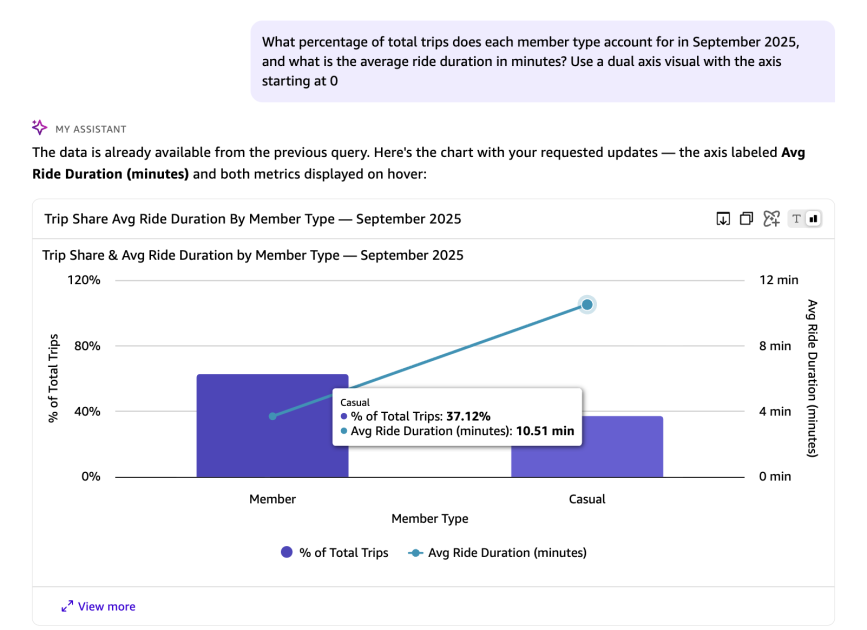
The next query asks two questions at once, both requiring metrics computed at runtime rather than stored in the dataset.
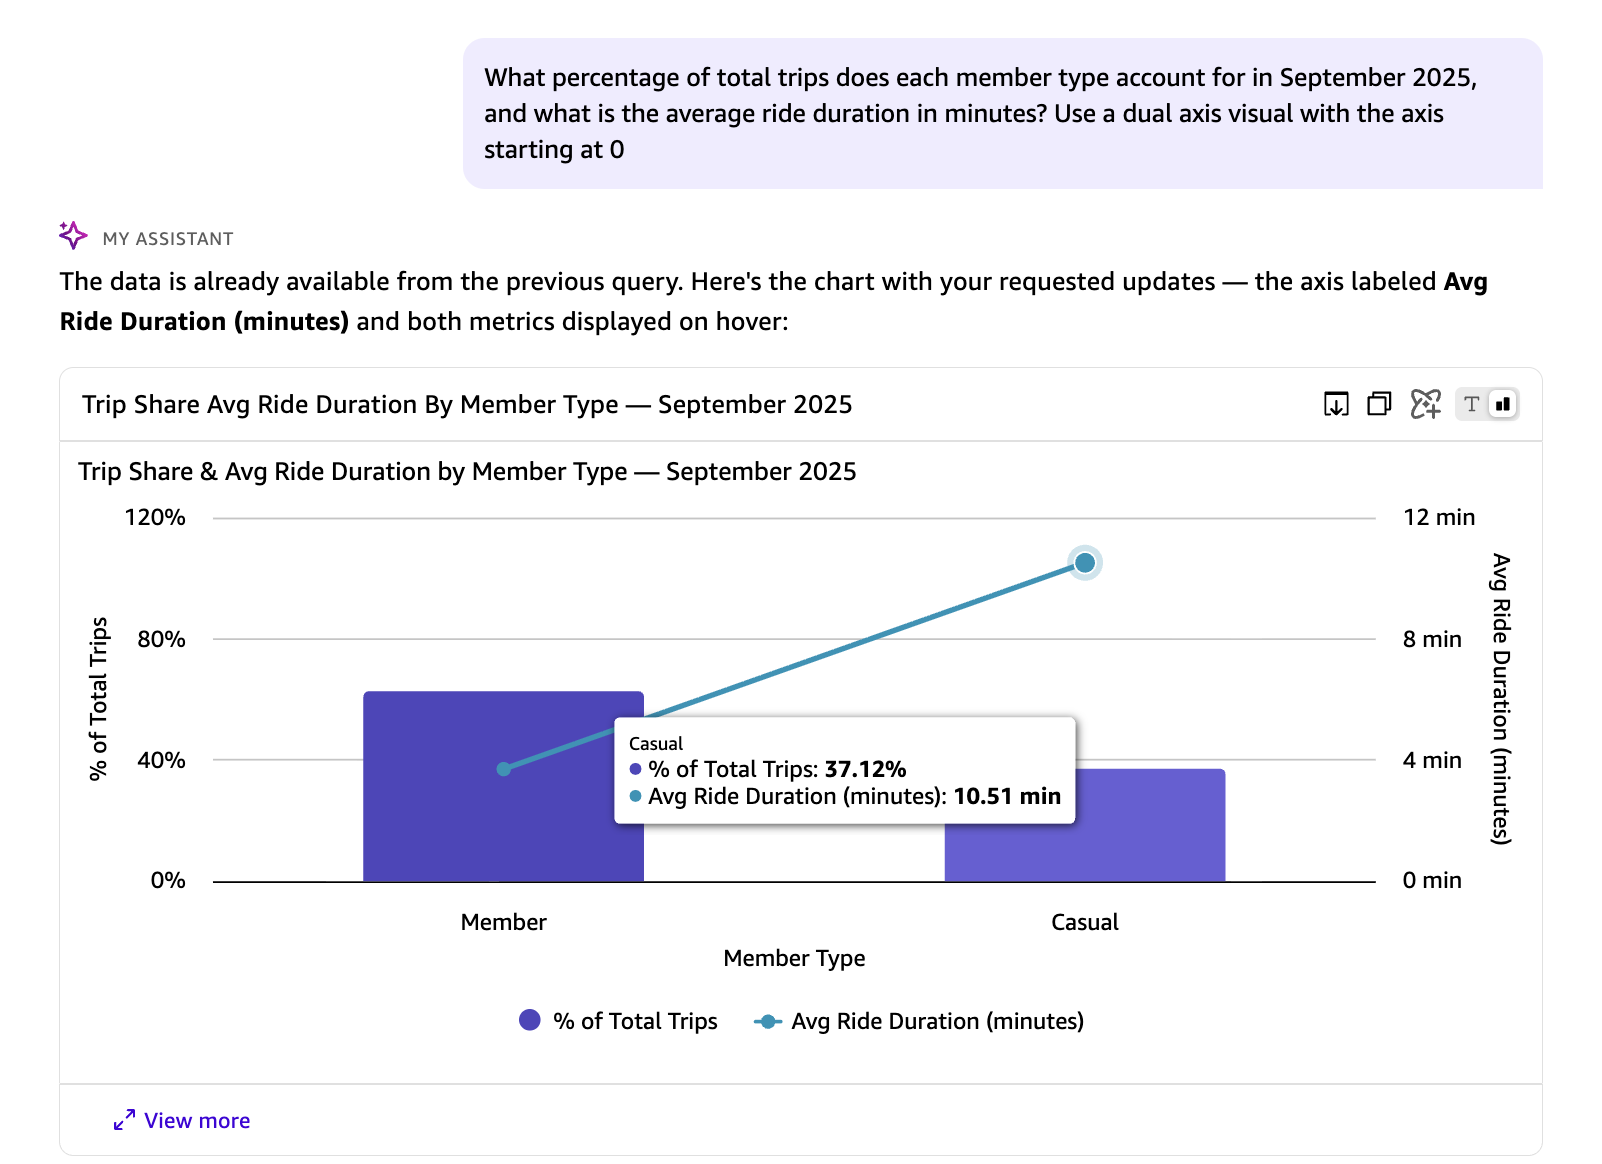 In the preceding response, the avg_duration_minutes and percentage_of_total_trips are runtime calculations that do not exist in the underlying dataset. You can also instruct Quick on the visual type and axis configuration to use for representing the results.The following SQL query is automatically generated by Quick in response to the natural language question above. It calculates the share of total trips and average ride duration for each rider type in September 2025, using window functions and date arithmetic:
Key components of this query:
- Window Function: SUM(COUNT(*)) OVER () calculates total trips across all rider types for percentage calculation.
- Percentage Calculation: COUNT(*) * 100.0 / SUM(COUNT(*)) OVER () computes each group’s share of total trips.
- Duration Calculation: AVG(DATEDIFF(‘minute’, started_at, ended_at)) calculates average trip duration in minutes.
- Filtering: Limits data to September 2025 (from September 1 to before October 1).
- Grouping: Groups by member_casual to separate member and casual riders.
- Ordering: Sorts by total trips in descending order.
Working with multiple datasets and spaces
Dataset Q&A isn’t limited to a single dataset. Whether you manually select a dataset, add multiple datasets, or curate a Space with mixed asset types, The built-in enterprise knowledge graph identifies the right source of data based on its interpretation of your question.
Adding a single dataset
The previous walkthrough demonstrated how to connect a single dataset through the knowledge picker and explore it with natural language questions. This is the most straightforward starting point for Dataset Q&A.
Adding multiple datasets
You can add multiple datasets to the knowledge picker and ask questions that span your data landscape. When multiple datasets are selected, the Quick Chat automatically routes each question to the most relevant dataset based on the question context and available schema.
Example scenario: A transportation analyst has access to both the Divvy bike trip dataset and a Chicago weather dataset. By selecting both datasets in the knowledge picker, they can ask:
Auto-discovery with All data and apps
You don’t even need to know which datasets are available. In Quick Chat, the knowledge picker provides an option to select All data and apps. When selected, you can ask a question and the system discovers the relevant datasets automatically, runs queries across them, and generates a unified response.
Curating a Space for cross-asset analysis
For the most comprehensive experience, organize related assets together using Amazon Quick Spaces. A Space is a collection of files, datasets, dashboards, and knowledge bases.Example scenario: A “Transportation Analytics” space might contain the Quick Sight Divvy bike trips dataset, a Chicago weather dataset, city infrastructure reports in PDF and event calendar in word formats, and existing Quick Sight transportation dashboards.
After this space is selected in the knowledge picker, you can ask questions that draw from all assets within it:
The Quick Chat automatically identifies which assets contain relevant information and synthesizes insights across structured data (datasets) and unstructured content (documents).
Use cases
The following examples represent four common patterns where Dataset Q&A delivers the most value.
Pattern 1: Progressive complexity without reconfiguration
What we demonstrated: Starting with monthly aggregations, the walkthrough showed progressively more complex questions, from defining custom metrics (average trip duration) to performing nested aggregations (percentage by member type), all without any setup or configuration changes.
Real-world scenario: A business analyst exploring sales data can start by asking “What were total sales last quarter?” and naturally move to “What percentage of revenue came from repeat customers in each region, and how did their average order value compare to new customers?” without waiting for a dashboard update.
Why this matters: Dataset Q&A supports iterative exploration where each question builds on the previous one, with context maintained throughout the conversation.
Benefit: Natural analytical workflow that matches how analysts think through problems.
Pattern 2: SQL Transparency with explainability for technical validation
What we demonstrated: For every query in the walkthrough, the generated SQL was available on demand, from straightforward aggregations to nested aggregations with window functions. With this transparency, we can verify that natural language was correctly interpreted before sharing results.
Real-world scenario: A data engineer must confirm that “What is the average order value for repeat customers who made purchases in both Q3 and Q4 2025?” correctly identifies repeat customers (those with orders in both quarters, not just either quarter) before sharing the result with executives.
With Dataset Q&A, technical users can:
- Understand how natural language questions are interpreted and executed through the Explainability feature.
- Review the generated query logic.
- Verify complex conditions such as AND vs. OR logic, date ranges, and aggregation levels.
- Request adjustments if the interpretation doesn’t match the intent.
- Validate the approach before sharing results with stakeholders.
Benefit: Confidence in results, ability to explain methodology, and technical credibility.
Pattern 3: Complete dataset analysis
What we demonstrated: Every query accessed the complete underlying dataset. The monthly analysis processed all 1,857,960 rides. The September percentage calculations aggregated across 714,562 rides. No sampling or truncation occurred.
Real-world scenario: An operations manager analyzing customer support tickets needs resolution patterns across all tickets from the past year. A question like “What percentage of tickets were resolved within SLA by priority level and support tier?” requires complete data for accurate insights.
Dataset Q&A queries the complete underlying dataset with SQL, delivering accurate aggregations across millions of records without sampling or truncation.
Benefit: Complete, accurate results for data-driven decision-making
Pattern 4: Multi-asset analysis
What this demonstrates: Dataset Q&A works when multiple datasets or a space with mixed assets (datasets + documents) are in scope, enabling holistic analysis across organizational data.
Real-world scenario: A transportation planner must understand how bike-sharing usage correlates with public transit ridership and city events. They created a “Transportation Analytics” Space containing:
- Divvy bike trip dataset (structured data)
- CTA transit ridership dataset (structured data)
- City events calendar (PDF document)
- Weather data (CSV file)
With this space selected, they can ask: “What was the impact of major events on bike and transit usage in October 2025?”
The conversational assistant:
- Identifies relevant structured data from bike trip and transit datasets
- Extracts event information from the PDF calendar
- Correlates weather patterns from the CSV file
- Synthesizes insights across all sources
Why this matters: Organizations rarely make decisions based on a single dataset. Dataset Q&A with Spaces enables analysis across data silos without manual data integration or complex ETL processes.
Benefit: Holistic, context-aware insights that reflect the full complexity of business operations.
Key distinctions
- Dataset Q&A opens up one-time exploration beyond pre-configured boundaries. It provides access to any field with custom runtime calculations in natural language, plus full SQL transparency for technical validation.
- Dashboard Q&A works well when exploring insights within the boundaries of what dashboard authors have configured, including specific visuals, fields, filters, and curated business logic with calculations.
- Topic Q&A shines when authors have created and maintained topic configurations with curated field definitions, synonyms, and custom instructions.
Supported data sources
Supported data sources are Amazon Athena, Amazon Redshift, Amazon Aurora PostgreSQL, and Amazon S3 Tables in direct query mode for Dataset Q&A at this time.
Current limitations
- Composite datasets are not supported when the parent datasets use SPICE and the child dataset is in direct query mode.
- Custom SQL datasets with parameters are currently not supported.
Cleaning up
To avoid incurring ongoing charges, delete the Divvy_Bike_Trips dataset that you created as part of this walkthrough. For instructions, see Deleting a dataset in the Amazon Quick documentation.
Conclusion
Dataset Q&A for datasets in Quick Sight within Amazon Quick removes the barriers between business questions and data insights. It gives analysts the flexibility to go beyond pre-configured dashboard boundaries, gives technical users the SQL transparency to validate complex logic, and gives everyone access to complete datasets without row limits.
This capability complements existing Dashboard Q&A and Topic Q&A features, giving you the right tool for every analytical scenario: curated insights when you need guardrails, and flexible exploration when your questions extend beyond pre-configured visualizations.


![KAIZEN Locations & Map Guide – Boss, Chest, Weapon, Style [KASHIMO]](https://www.destructoid.com/wp-content/uploads/2026/02/kaizen-locations-and-map-guide.jpg)